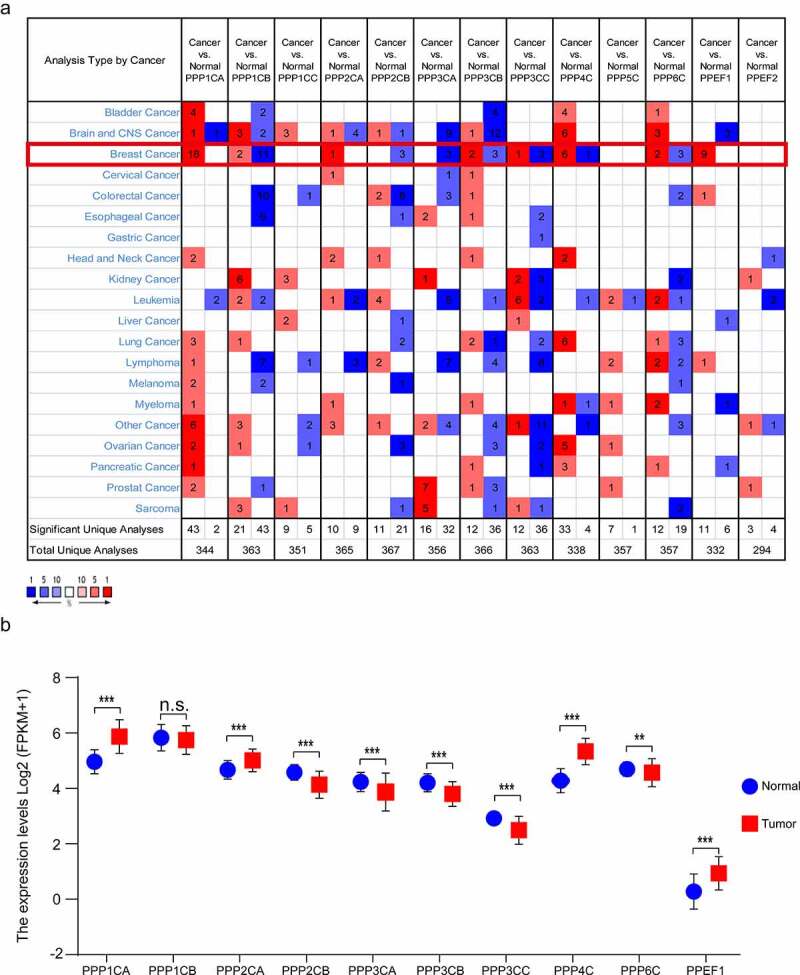
Figure 1.

Transcription of the PPPCs family in breast cancer. (a) Comparison of the PPPCs family between normal breast tissues and breast cancer tissues using the Oncomine database. Red and blue colors represent relatively high and low expression of mRNA in the corresponding group, respectively. P-value <0.05, |fold change| >1.5, and gene ranking in the top 5% were set as the thresholds. (b) Comparison of the PPPCs family between normal breast tissues and breast cancer tissues using the TCGA database. Two paired samples Student’s t-test or the Wilcoxon signed rank test was used to compare the mRNA difference of two paired groups. *P < 0.05, **P < 0.01, ***P < 0.001 and ns: not significant.
