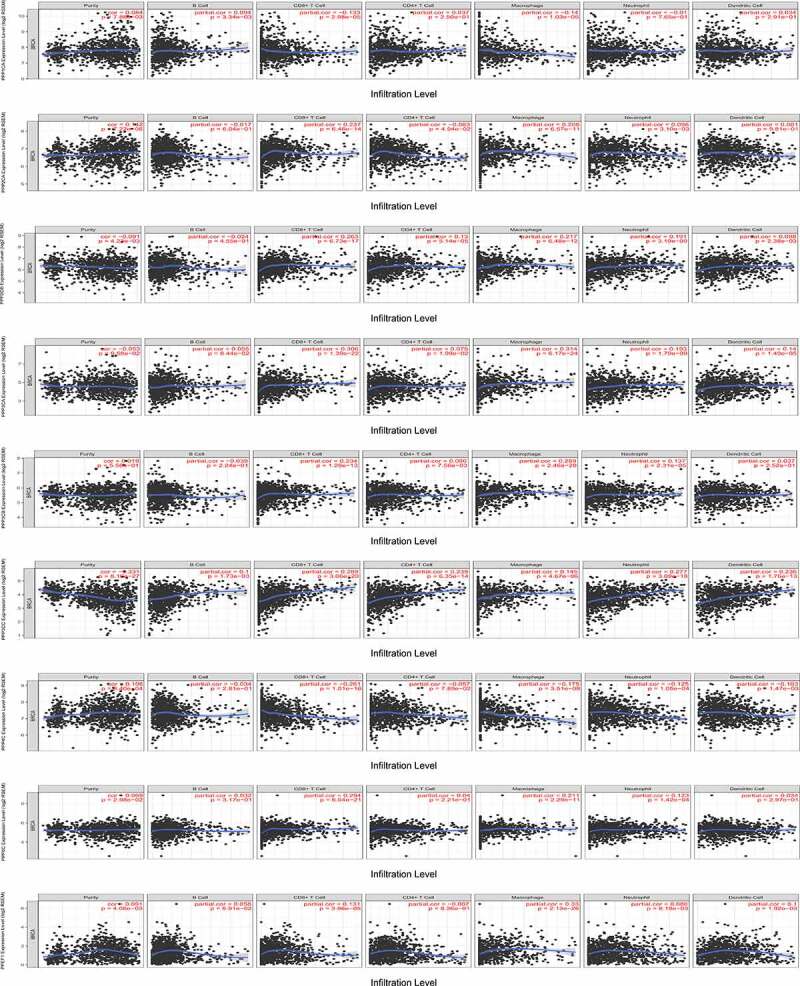
Figure 8.

Relationship between the expression levels of the DEGs and immune cell infiltration. The correlations between the mRNA expression levels of the DEGs and immune cell infiltration were calculated by the TIMER database. |Partial correlation|>0.1 and P-value <0.05 were set as the thresholds.
