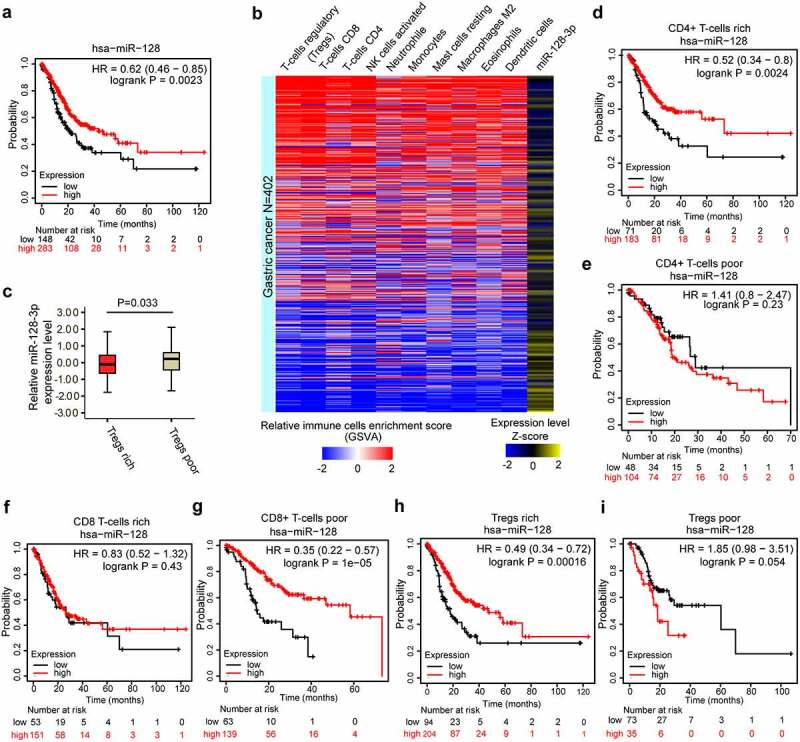
Figure 1.

miR-128-3p expression is related to the prognosis of GC and inversely correlated with immune cell infiltration in GC. (a) The prognostic value of miR-128 expression in GC assessed by Kaplan–Meier plotter. (b) Heatmap of the enrichment scores of different immune cells from GSVA (blue and red) and the expression levels of miR-128-3p (blue and yellow) from 402 TCGA GC samples. Color intensity corresponds to the enrichment score or the expression level Z-score: blue represents low expression, and red or yellow represents high expression. (c) Differences in the expression of miR-128-3p between the Treg-rich group and the Treg-poor group. The OS analysis of miR-128 expression in GC based on different cellular contents in GC, including CD4 + T cells-rich (d), CD4 + T cells-poor (e), CD8 + T cells-rich (f), CD8 + T cells-poor (g), Tregs-rich (h), and Tregs-poor (i) samples, determined by Kaplan–Meier plotter. GC, gastric cancer. OS, overall survival.
