Figure 1.

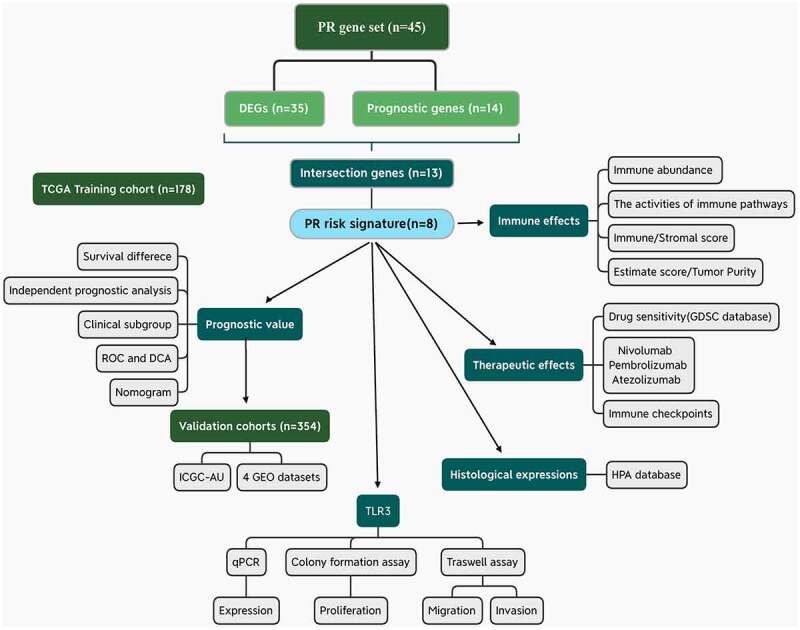
Flow chart of the present study. PR, pyroptosis-related; DEGs, differentially expressed genes; ROC, receiver operating characteristic curve; DCA, decision curve analysis.

Flow chart of the present study. PR, pyroptosis-related; DEGs, differentially expressed genes; ROC, receiver operating characteristic curve; DCA, decision curve analysis.