
Figure 2.
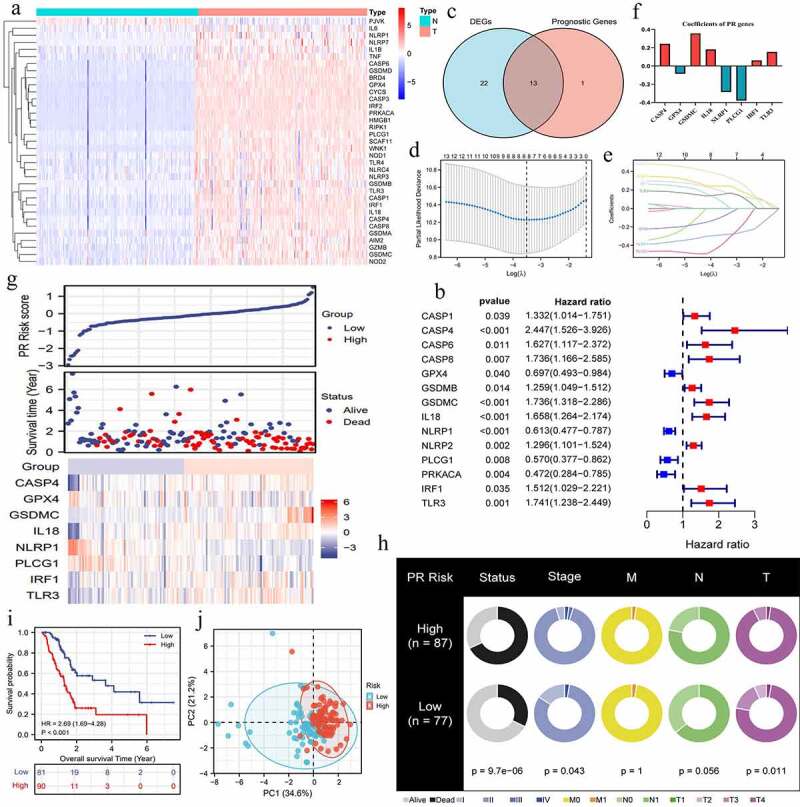
Construction of pyroptosis-related risk signature. (a) The heat map of pyroptosis DEGs. The absolute value of Log2FC is greater than or equal to 0.58. (b) Prognosis-related pyroptosis genes. (c) Venn plot exhibits the intersection between pyroptosis DEGs and prognostic PRGs. (d, e) The analytical process of lasso regression analysis. (f) The coefficients of each PRG in PR risk signature. (g) The risk plots of PR risk signature. (h) The relationships between PR risk score and PAAD clinicopathological features. (i) The survival difference between high- and low-PR risk group. (j) PCA results in TCGA cohort. PR, pyroptosis-related; DEGs, differentially expressed genes; PRGs, pyroptosis-related genes; PAAD, pancreatic adenocarcinoma; PCA, Principal component analysis.