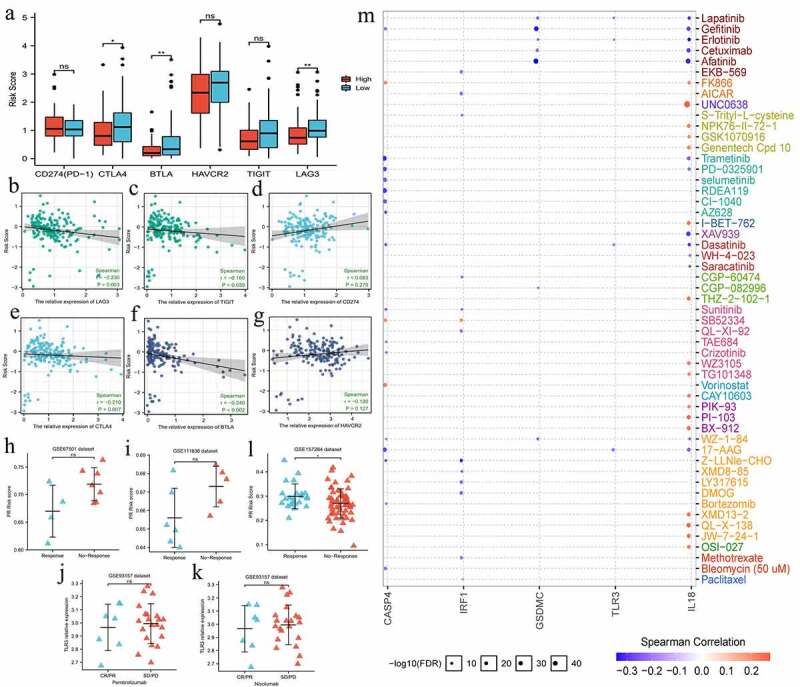
Figure 7.

The effects of pyroptosis-related risk score on the efficacy of PD-1/L1 inhibitors. (a) The expressive differences of 6 ICs between high- and low-PR risk groups. (b-g) The expressive correlations between PR risk score and 6 ICs. (h-k) The differences in PR risk score between response- and non-response patients for PD-1/L1 inhibitors treatments. (m) The relationships between the expressions of 8 risk PRGs and the sensitivities (IC50) of multiple drugs. PR, pyroptosis-related; PRGs, pyroptosis-related genes; ICs, immune checkpoints; IC50, half maximal inhibitory concentration; ns, not significantly; *p < 0.05, **p < 0.01.
