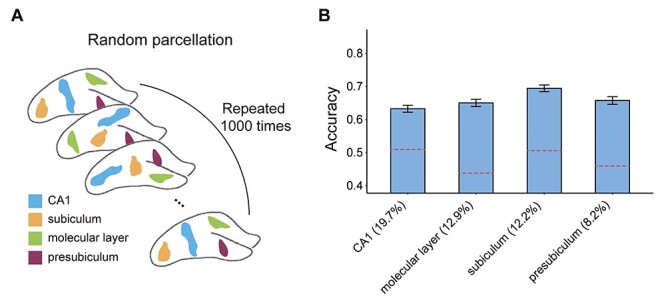
Figure 5 .

Random occlusion analysis for the major hippocampal subfields. (A) The potential confounding effect of subfield size was assessed by repeating the occlusion analysis 1000 times, each time occluding random parcels, which are of the same size as the presubiculum, subiculum, CA1, and molecular layer but are placed at random spatial locations. (B) The results of the random occlusion analysis are shown with reference to each of the four hippocampal subfields (the relative size of each mask is indicated as % of total hippocampal volume). Dashed red lines denote the original accuracy loss observed (same as Fig. 3C). Error bars denote standard deviation.
