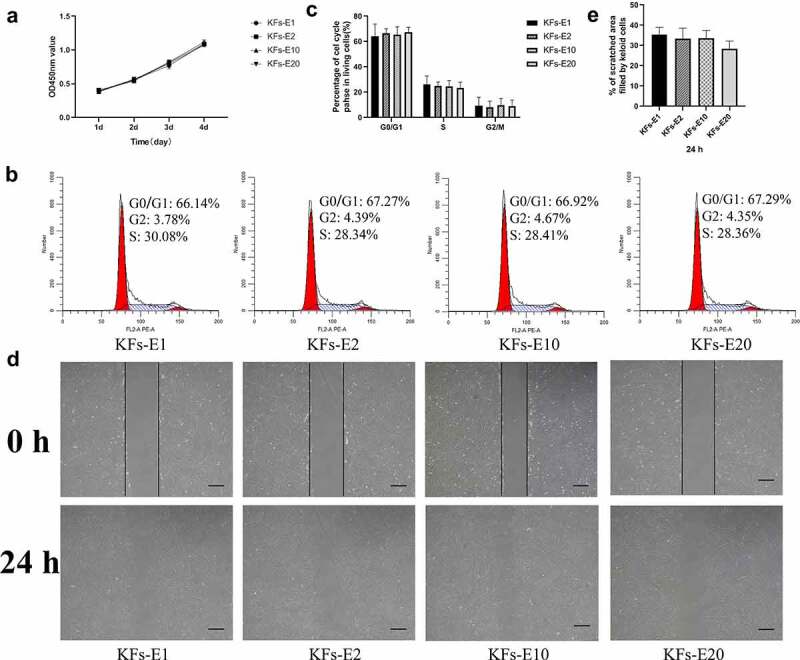
Figure 3.

Comparison of biological behavior of KFs-E2, KFs-E10, and KFs-E20 with KFs-E1. a The CCK-8 assay was used to analyze the proliferation of KFs-E1, KFs-E2, KFs-E10, and KFs-E20 at days 1, 2, 3, and 4 (P > 0.05 vs KFs-E1). b Representative cell cycle data plotted for each group. c Flow cytometry analysis of cell cycle for each group (P > 0.5 vs KFs-E1). d Representative images obtained at 0 and 24 h after scratching (× 40, bar = 200 μm). e Semiquantitative analysis of scratch assay results (P > 0.1 vs KFs-E1).
