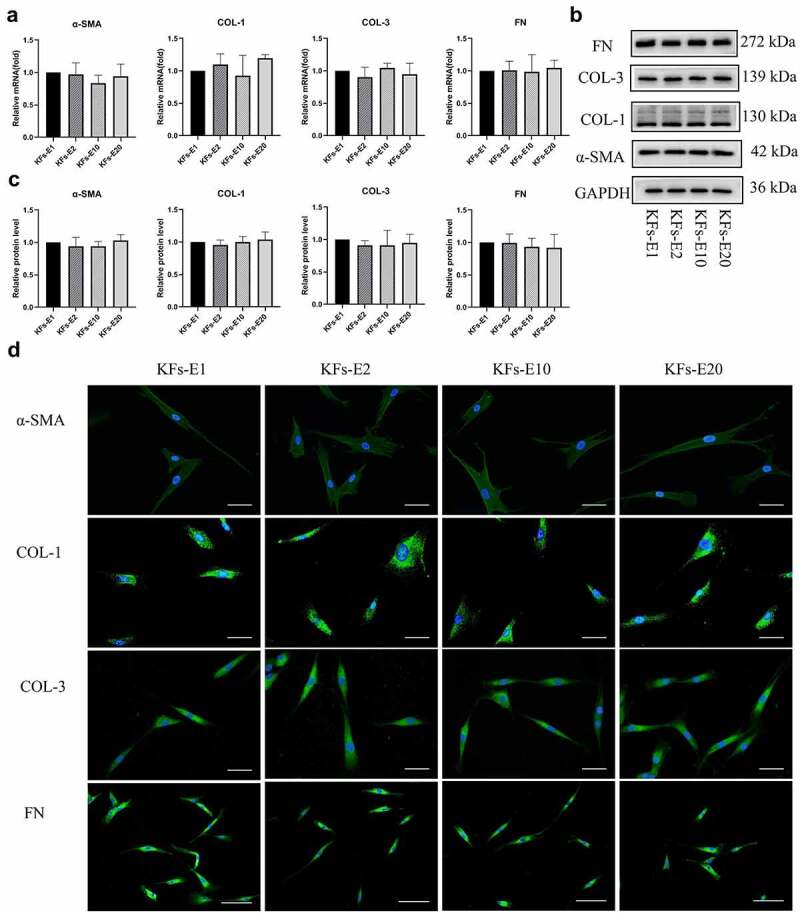
Figure 4.

Comparison of ECM related gene expression of KFs-E2, KFs-E10, and KFs-E20 with that of KFs-E1. a qPCR analysis comparing α-SMA, COL-1, COL-3, and FN expression in KFs-E2, KFs-E10, and KFs-E20 with that in KFs-E1 (P > 0.1 vs KFs-E1). b Western blot analysis of α-SMA, COL-1, COL-3, and FN production. c Semi-quantification of the Western blot results (P > 0.5 vs KFs-E1). d Fluorescence microscopy image of intracellular α-SMA, COL-1, COL-3, and FN expression (α-SMA, COL-1 and COL-3, × 400, bar = 20 μm. FN, × 200, bar = 50 μm).
