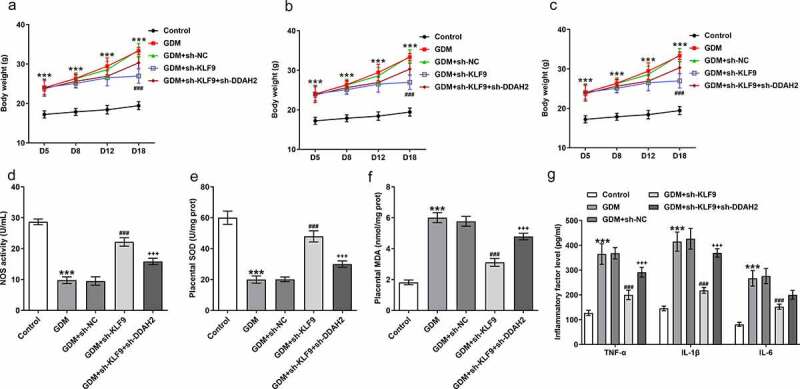
Figure 7.

The impact of KLF9/DDAH2 axis on the in vivo GDM mice model. (a) The bood weights, (b) blood glucose and (c) insulin level were measured in GDM mice injected into sh-KLF9 and sh-DDAH2. (d) The oxidative stress indexes and (e) inflammatory cytokines detected in GDM mice using their corresponding commercial kits. ***p < 0.001 vs Control; ###p < 0.001 vs GDM+sh-NC; +++p < 0.001 vs GDM+sh-KLF9.
