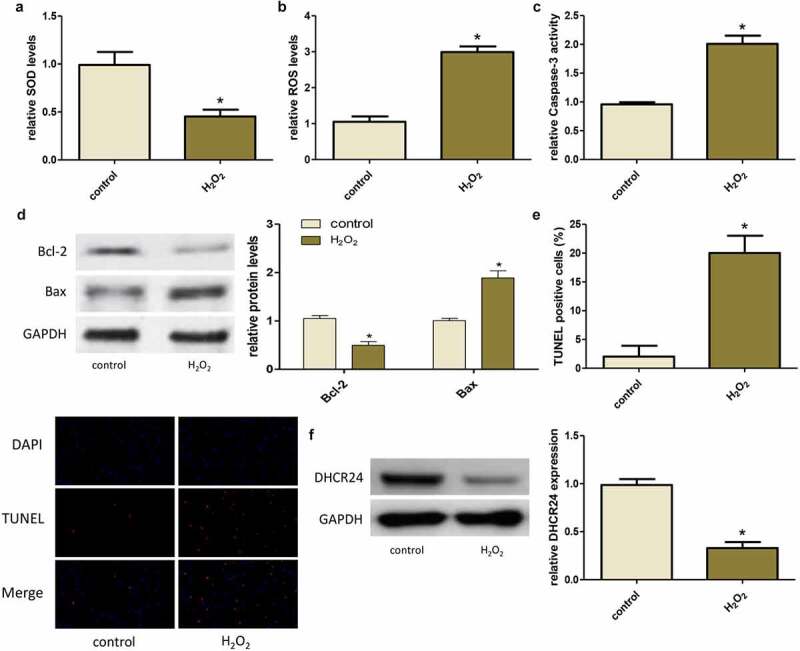
Figure 2.

H2O2 induced oxidative stress and apoptosis of A549 cells and down-regulated DHCR24. (a) The levels of SOD in A549 cells were detected by SOD activity assay (‘*’ p < 0.05 vs. control, n = 3). (b) The contents of ROS in A549 cells were detected by DHR-ROS test kit (‘*’ p < 0.05 vs. control, n = 3). (c) The Caspase-3 activity of A549 cells was detected (‘*’ p < 0.05 vs. control, n = 3). (d) Western blot analysis of Bcl-2 and Bax (‘*’ p < 0.05 vs. control, n = 3). (e) Results of TUNEL staining of A549 cells (200×) (‘*’ p < 0.05 vs. control, n = 3). (f) Western blot analysis of DHCR24 (‘*’ p < 0.05 vs. control, n = 3)
