Figure 1.

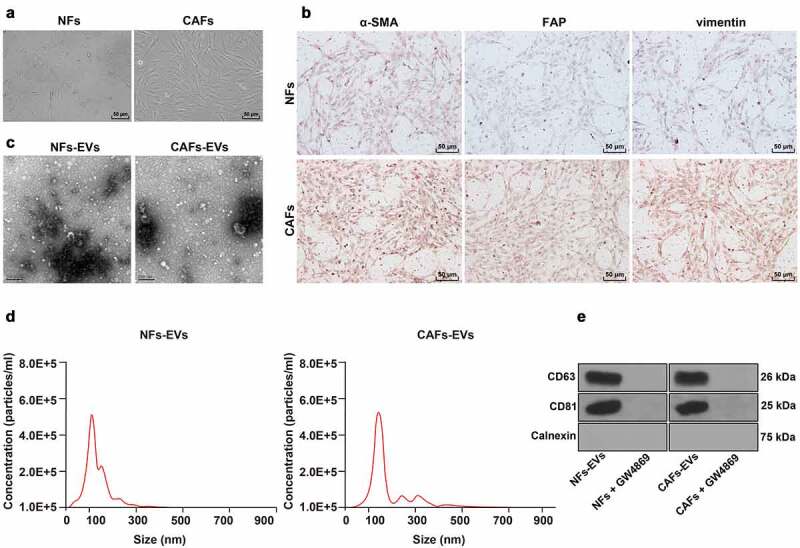
Identification of CAFs and CAFs-EVs. CAFs and EVs were extracted from NSCLC tissue. A: Microscope was used to observe the morphology of CAFs; B: Immunocytochemistry was adopted to detect the expressions of α-SMA (smooth muscle alpha-actin), vimentin and FAP (fibroblast activation protein) in CAFs; C: Electron microscope was used to observe the morphology of CAFs-EVs; D: Nanoparticle tracking analysis (NTA) was performed to analyze the size and concentration of EVs; E: Western blot was used to test the levels of EVs-specific markers CD63, CD81, and Calnexin. The cell experiment in panels C-D was repeated 3 times independently.
