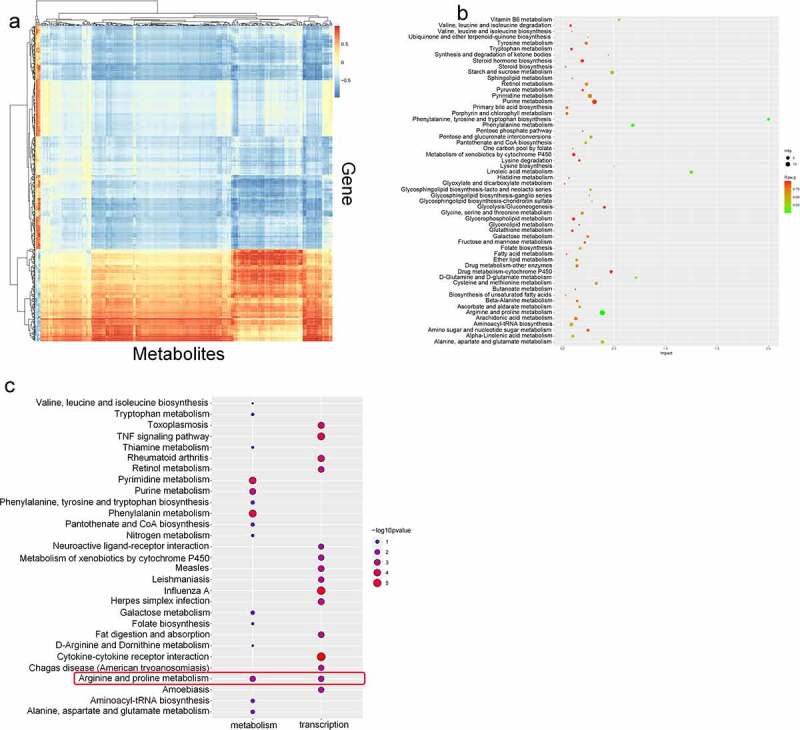
Figure 4.

Combined metabolomic and transcriptomic analyses. A. Correlation analysis of the transcriptome and metabolome. The abscissa represents the metabolite, and the ordinate shows the gene. The red indicates a positive correlation, the blue indicates a negative correlation, and the color shade indicates the magnitude of the correlation. B. Integrated KEGG analysis of differentially expressed genes and differentially expressed metabolites C. Comparison of the enriched metabolic pathways related to the differential transcriptome and metabolome based on KEGG pathway analysis.
