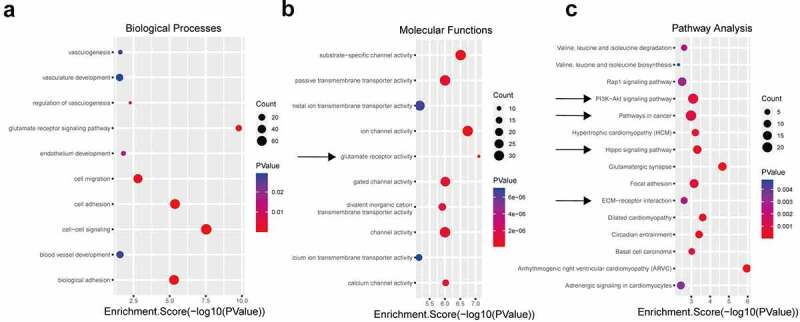
Figure 2.

GO and KEGG analyses of the differentially expressed circRNAs. Using P ≤ 0.05 as the threshold, 10 biological process (a) and molecular function (b) items showed significant changes. The top 15 enriched signaling pathways in the KEGG analysis (c).
