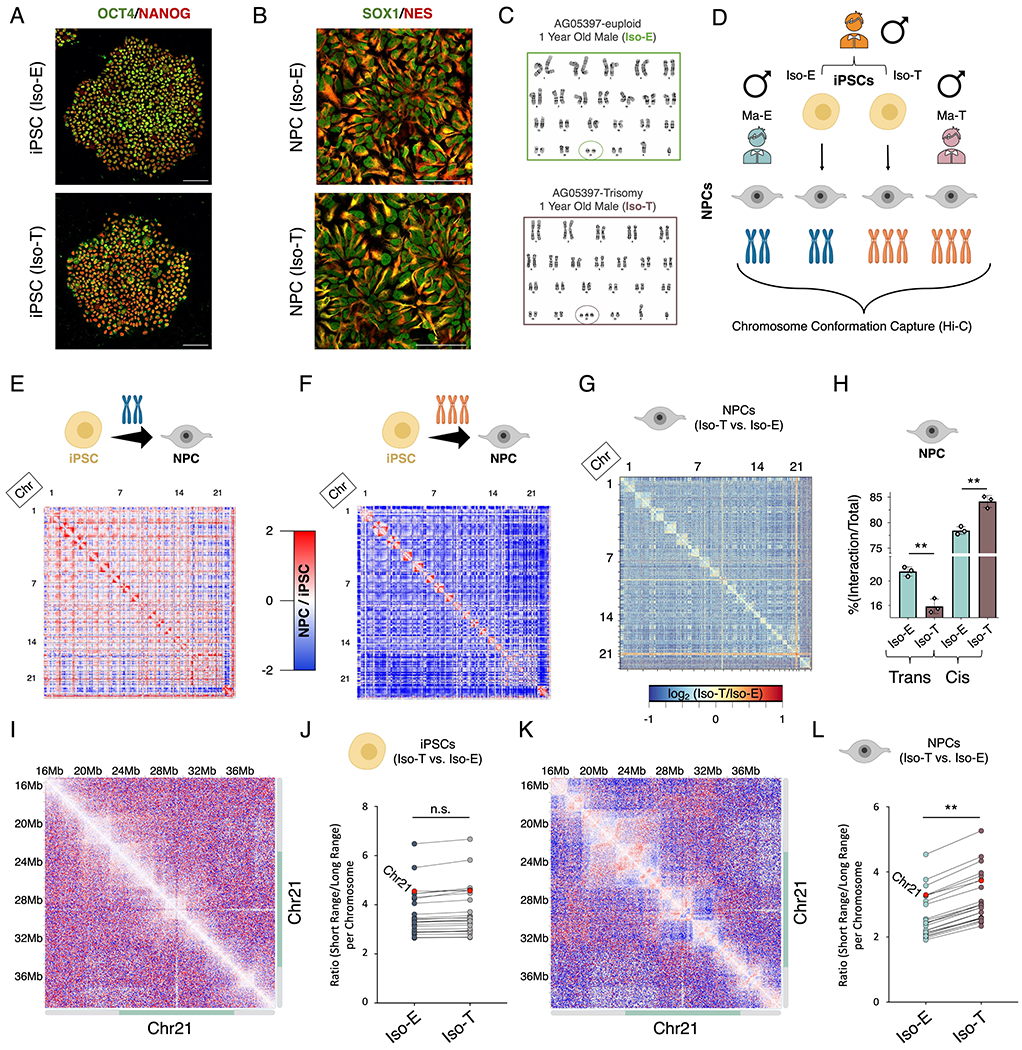
Figure 1 – T21 induces genome-wide chromosomal introversion in NPCs but not iPSCs.

Immunofluorescence staining of (A) iPSCs (OCT4 (green), NANOG (red)) and (B) NPCs (SOX1 (green), Nestin (red)) from the isogenic pair (Iso-E (top) and Iso-T (bottom) as well as (C) respective G-band karyotyping of NPCs. (D) Schematic of experimental design to assess the 3D-genome of the isogenic pair iPSCs and NPCs as well as the euploid (Ma-E) and trisomic (Ma-T) male NPCs. (E-H) Comparative Hi-C analysis of Iso-E and Iso-T iPSCs and NPCs. Genome-wide differential (NPC/iPSC) Hi-C interaction maps for Iso-E (E) and Iso-T (F). (G) Genome-wide differential (Iso-T/Iso-E) Hi-C interaction maps for NPCs. (H) Percent distribution of trans- and cis-chromosomal interactions for the isogenic pair of NPCs. (I-L) Representative images of chromosome 21 (chr21) differential cis-chromosomal interaction maps for the isogenic pair of iPSCs (I) and NPCs (K). Dot plots representing the ratio of short-range (<1Mb) to long-range (>1Mb) interactions for the isogenic pair of iPSCs (J) and NPCs (L). Each dot represents a chromosome and chr21 is represented as a red dot. Wilcoxon rank-sum test shows that euploid and trisomic iPSCs were not statistically different (p-value=0.536) whereas NPCs show significantly increased short range interactions in the trisomic NPCs (p-value=0.004).
