
Figure 2 – T21 induced reorganization of TADs and loops are segregated into A/B compartments.
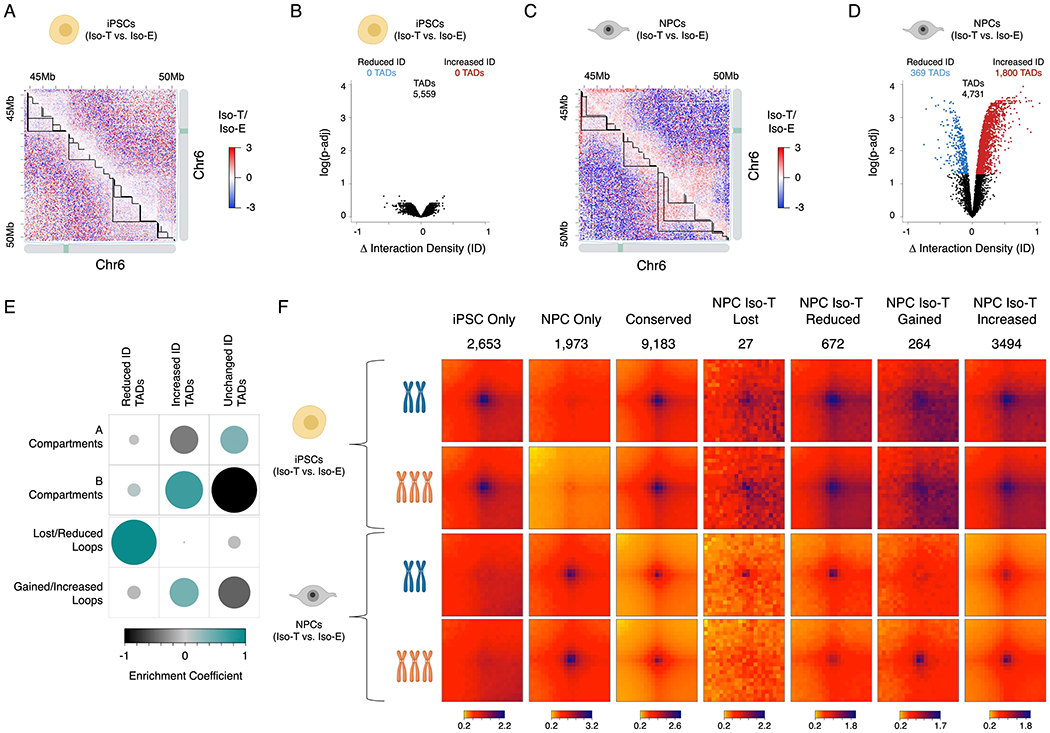
Representative images of differential Hi-C interaction maps (Iso-T/Iso-E) of a region on chromosome 6 (chr6) in the isogenic pair of iPSCs (A) and NPCs (C). Volcano plot of differential interaction density (ID) within TADs in the isogenic pair of iPSCs (B) and NPCs (D). (E) Randomized permutation test analysis between the differential interaction density (ID) TADs with A/B compartments and differential chromosomal loops in NPCs. Color intensity (positive correlations are displayed in green and negative correlations in black) and the size of the circle are proportional to the enrichment coefficients of A/B compartments with differentially interacting TADs identified as a consequence of T21 in NPCs. (F) Aggregate Peak Analysis (APA) analysis of loops uniquely identified in iPSCs (top rows), NPCs (bottom rows) in both Iso-E and Iso-T.