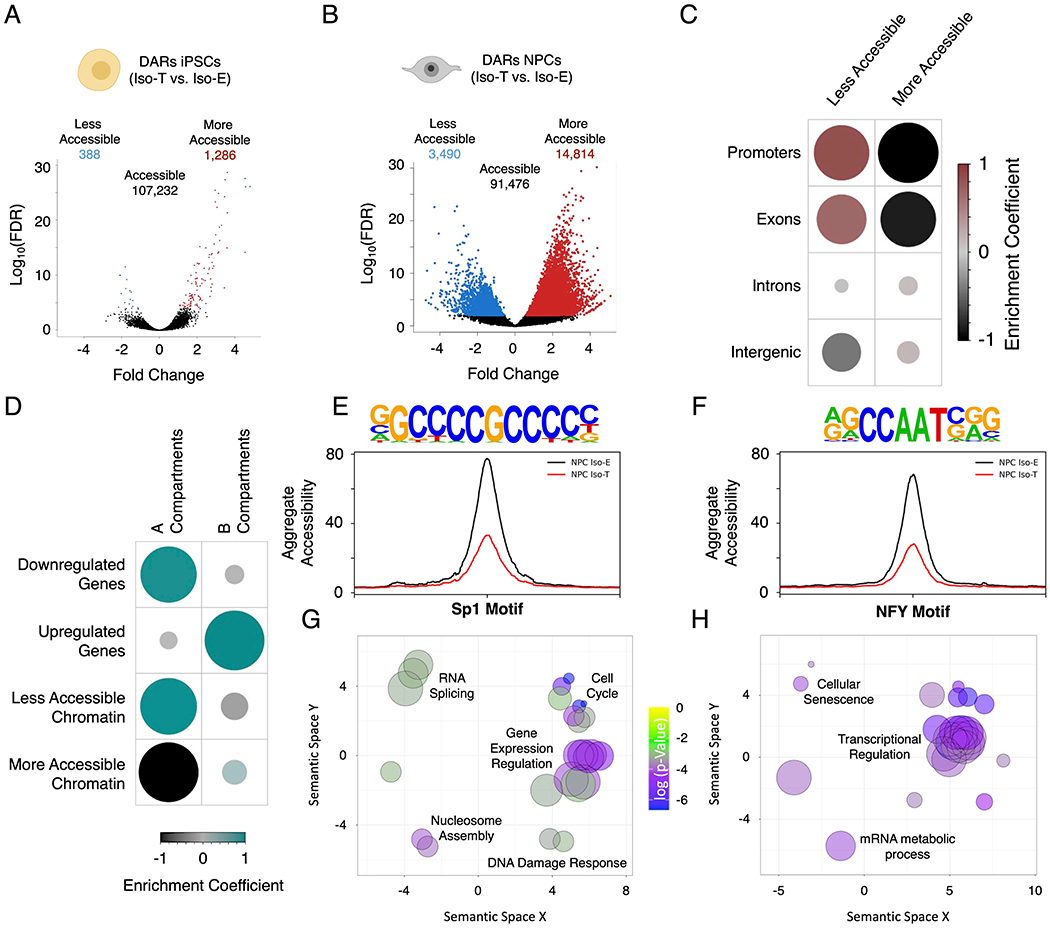
Figure 5 – T21-induced genome-wide disruption of chromatin state in NPCs is associated with transcriptional downregulation.

(A, B) Volcano plots of differentially accessible regions (DARs) identified by ATAC-sequencing in the isogenic pair of iPSCs (A) and NPCs (B). (C) Enrichment heatmap of the randomized permutation test between the DARs on promoters, exons, introns and intergenic regions with accessible regions genome-wide. Color intensity (positive correlations are displayed in red and negative correlations in black) and the size of the circle are proportional to the enrichment coefficients. (D) Enrichment heatmap of the randomized permutation test between the A/B compartments and DEGs and DARs. Color intensity (positive correlations are displayed in green and negative correlations in black) and the size of the circle are proportional to the enrichment coefficients of the specific genetic features with the A/B compartments. (E, F) Aggregate plots of less accessible regions harboring SP1 (E) and NFY (F) motifs. (G, H) Gene ontology visualized in semantic similarity-based scatterplots for downregulated genes with less accessible promoters harboring SP1 (G) and NFY (H) motifs.
