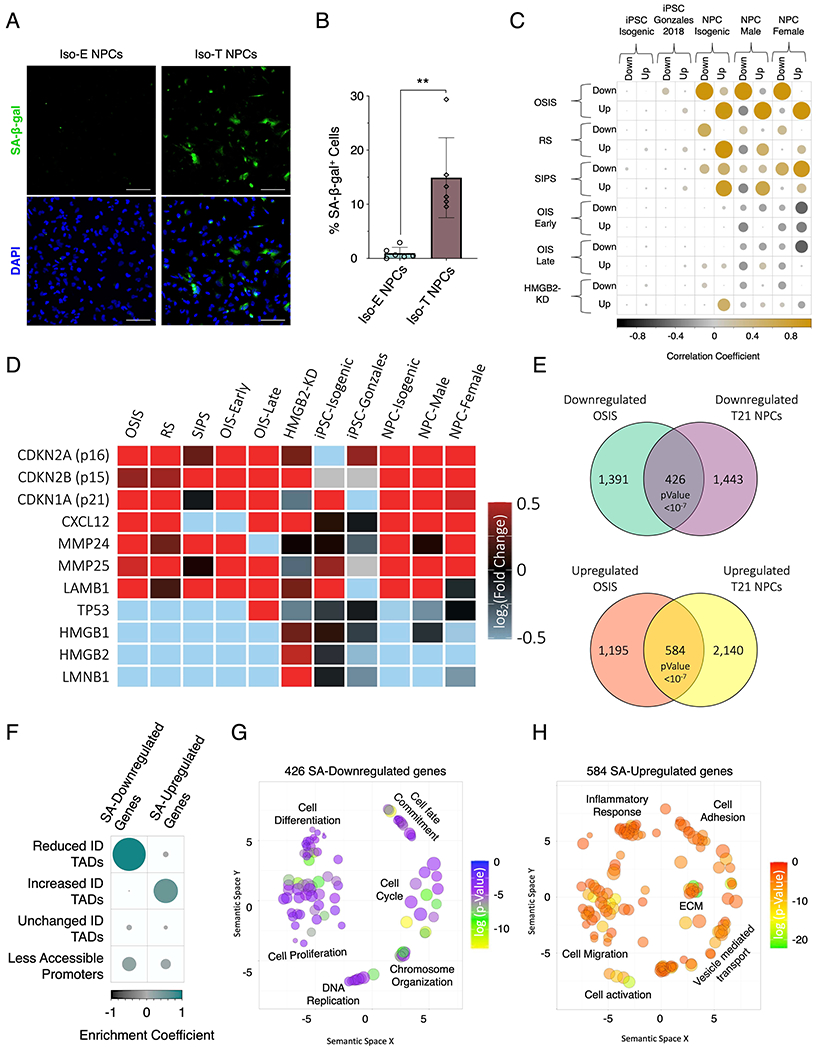
Figure 6 – T21 induces senescence in NPCs.

(A) Senescence associate β-galactosidase staining (SA-β-gal, green) marking senescent NPCs in euploid NPCs (left) and T21 (right). (B) Quantification of SA-β-gal staining intensity in the isogenic pair of NPCs. Each dot on the histogram represents a replicate experiment of ~200 cells analyzed for the isogenic pair of NPCs. (C) Correlation heatmap of the randomized permutation test of DEGs identified in isogenic, male, and female control and T21 iPSCs and NPCs as well as DEGs identified from a previous published iPSC data set (Gonzales), compared to previously published DEGs identified in various modes of senescence induction (oxidative stress induced senescence (OSIS), replicative senescence (RS), stress induced senescence (SIPS), oncogene induced senescence (OIS) at early and late timepoints, as well as senescence entry induced by HMGB2 knock down (HMGB2-KD). Color intensity (positive correlations are displayed in yellow and negative correlations in black) and the size of the circle are proportional to the enrichment coefficients. (D) Gene expression heatmap of senescence marker genes as fold change of T21/E21 or senescent/control. (E) Venn diagram of overlapping downregulated (top) and upregulated (bottom) identified in NPCs harboring T21 and compared to DEGs identified in OSIS induced senescent cells. (F) Enrichment heatmap of the randomized permutation test between DEGs identified in both T21-NPCs and OSIS-induced senescent cells with differential ID TADs as well as reduced promoter-accessibility. Color intensity (positive correlations are displayed in green and negative correlations in black) and the size of the circle are proportional to the enrichment coefficients. (G, H) Gene ontology visualized in semantic similarity-based scatterplots for downregulated (G) and upregulated (H) overlapping genes identified in both T21-NPCs and OSIS-induced senescent cells.
