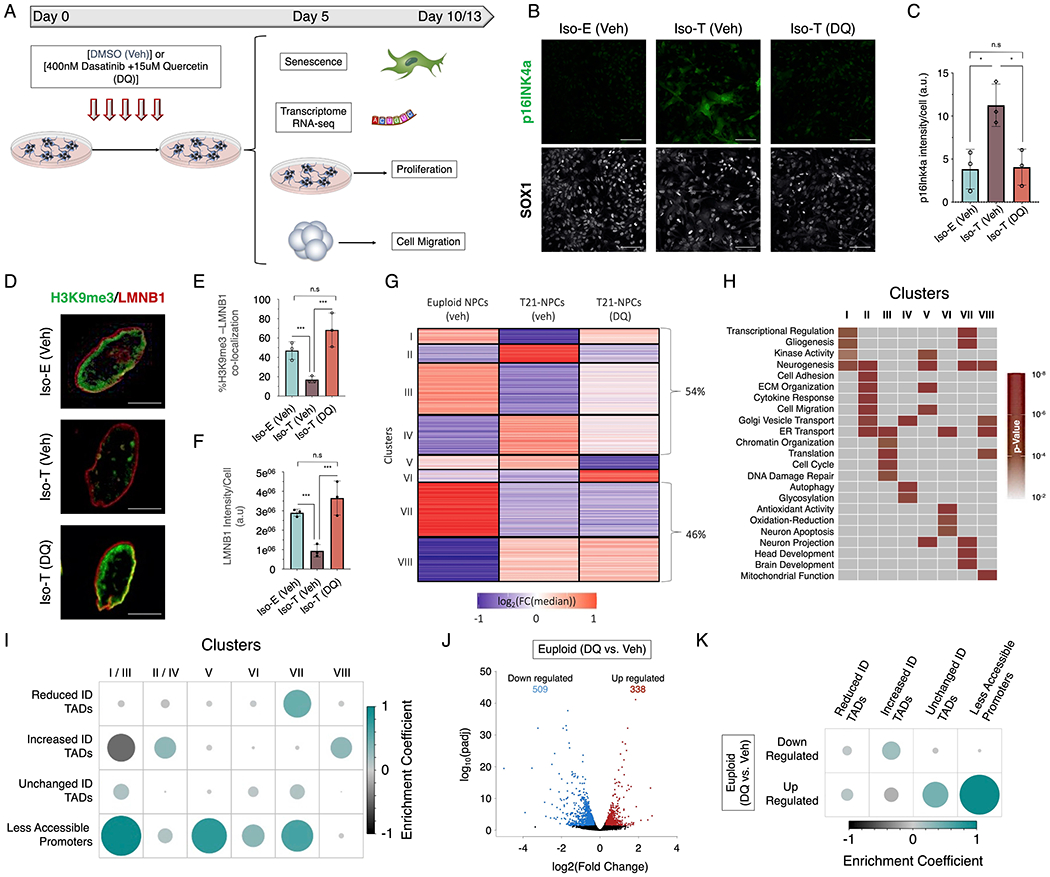
Figure 7 – Senolytic drug alleviates the transcriptional and cellular dysfunctions induced by T21 in NPCs.

(A) Schematic of experimental design to assess the transcriptional and cellular consequences of the senolytic drug (DQ) treatment in isogenic T21 NPCs. (B) Immunofluorescence of p16INK4a (green) in euploid (Iso-E) and trisomic (Iso-T) NPCs (marked by SOX1, white) treated with vehicle or DQ. (C) Quantification of p16INK4a staining intensity in euploid (Iso-E) and trisomic (Iso-T, vehicle or DQ treatment) NPCs. (D) Immunofluorescence of H3K9me3 (green) and LMNB1 (red) in euploid (Iso-E) and trisomic (Iso-T) NPCs treated with vehicle or DQ. (E) Quantification of co-localization between H3K9me3 and LMNB1 in euploid (Iso-E) and trisomic (Iso-T) NPCs and (F) quantification of LMNB1 staining intensity of NPCs treated with vehicle or DQ. Each dot on the histogram represents a replicate and ~200 nuclei were analyzed per condition. (G) K-means clustering of the transcriptomic analysis of euploid (Iso-E) and trisomic (Iso-T) NPCs (treated with vehicle or DQ) identified 8 distinct clusters. Values in heatmap are plotted as the log2 fold change from the median. (H) Gene ontology of biological process associated with the 8 transcriptional clusters identified in response to senolytic drug treatment. (I) Enrichment plot of the randomized permutation test between the genes identified in the 8 different clusters with differential ID TADs as well as less accessible promoters. Genes from cluster I and III as well clusters II and IV were merged for this analysis. Color intensity (positive correlations are displayed in green and negative correlations in black) and the size of the circle are proportional to the enrichment coefficients. (J) Volcano plots of the differentially expressed genes (DEGs) identified in euploid NPCs treated with vehicle (DMSO) or DQ. (K) Enrichment plot of the randomized permutation test between DEGs identified in DEGs identified after DQ treatment with differential ID TADs as well as reduced promoter-accessibility. Color intensity (positive correlations are displayed in green and negative correlations in black) and the size of the circle are proportional to the enrichment coefficients.
