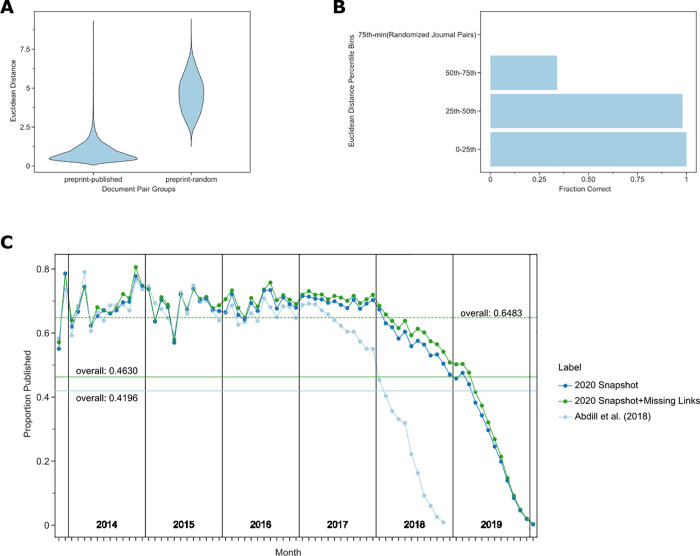
Fig 2.
(A) Preprints are closer in document embedding space to their corresponding peer-reviewed publication than they are to random papers published in the same journal. (B) Potential preprint–publication pairs that are unannotated but within the 50th percentile of all preprint–publication pairs in the document embedding space are likely to represent true preprint–publication pairs. We depict the fraction of true positives over the total number of pairs in each bin. Accuracy is derived from the curation of a randomized list of 200 potential pairs (50 per quantile) performed in duplicate with a third rater used in the case of disagreement. (C) Most preprints are eventually published. We show the publication rate of preprints since bioRxiv first started. The x-axis represents months since bioRxiv started, and the y-axis represents the proportion of preprints published given the month they were posted. The light blue line represents the publication rate previously estimated by Abdill and colleagues [13]. The dark blue line represents the updated publication rate using only CrossRef-derived annotations, while the dark green line includes annotations derived from our embedding space approach. The horizontal lines represent the overall proportion of preprints published as of the time of the annotated snapshot. The dashed horizontal line represents the overall proportion published preprints for preprints posted before 2019. Data for the information depicted in this figure are available at https://github.com/greenelab/annorxiver/blob/master/FIGURE_DATA_SOURCE.md#figure-two.

