Fig 3.
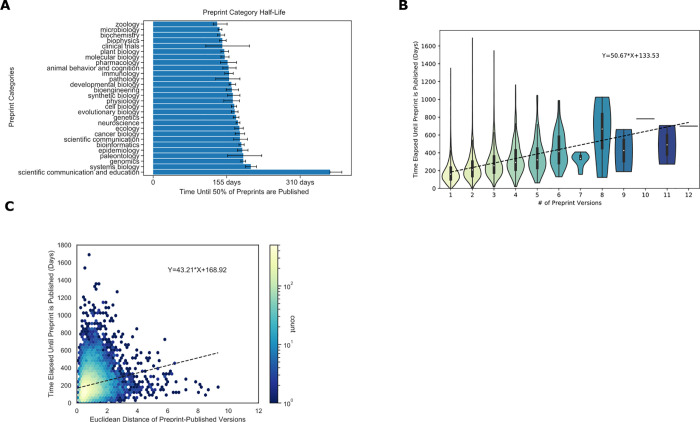
(A) Author-selected categories were associated with modest differences in the median time to publish. Author-selected preprint categories are shown on the y-axis, while the x-axis shows the median time-to-publish for each category. Error bars represent 95% confidence intervals for each median measurement. (B) Preprints with more versions were associated with a longer time to publish. The x-axis shows the number of versions of a preprint posted on bioRxiv. The y-axis indicates the number of days that elapsed between the first version of a preprint posted on bioRxiv and the date at which the peer-reviewed publication appeared. The density of observations is depicted in the violin plot with an embedded boxplot. (C) Preprints with more substantial text changes took longer to be published. The x-axis shows the Euclidean distance between document representations of the first version of a preprint and its peer-reviewed form. The y-axis shows the number of days elapsed between the first version of a preprint posted on bioRxiv and when a preprint is published. The color bar on the right represents the density of each hexbin in this plot, where more dense regions are shown in a brighter color. Data for the information depicted in this figure are available at https://github.com/greenelab/annorxiver/blob/master/FIGURE_DATA_SOURCE.md#figure-three.

