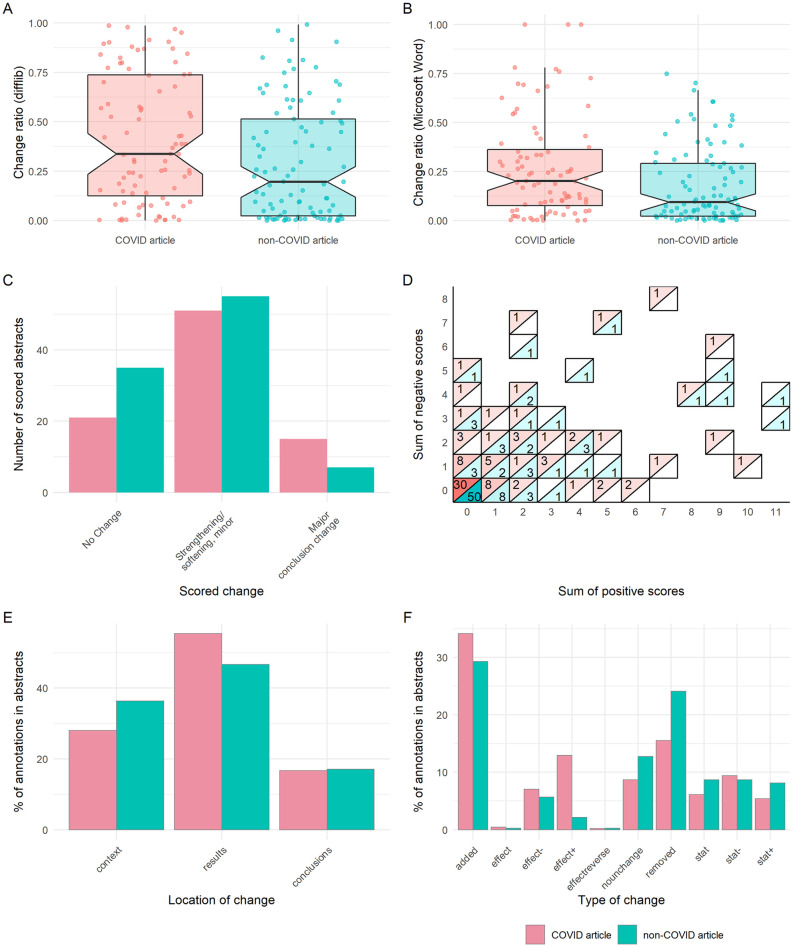
Fig 3. Preprint–publication abstract pairs have substantial differences in text, but not interpretation.
(A) Difflib calculated change ratio for COVID-19 or non-COVID-19 abstracts. (B) Change ratio calculated from Microsoft Word for COVID-19 or non-COVID-19 abstracts. (C) Overall changes in abstracts for COVID-19 or non-COVID-19 abstracts. (D) Sum of positive and negative annotations for COVID-19 or non-COVID-19 abstracts, with colour and label denoting number of abstracts with each particular sum combination. (E) Location of annotations within COVID-19 or non-COVID-19 abstracts. (F) Type of annotated change within COVID-19 or non-COVID-19 abstracts. All panels describe sample of abstracts analysed in detail (n = 184). Boxplot notches denote approximated 95% CI around medians. The data underlying this figure may be found at https://github.com/preprinting-a-pandemic/preprint_changes and https://zenodo.org/record/5594903#.YXUv9_nTUuU. CI, confidence interval; COVID-19, Coronavirus Disease 2019.

