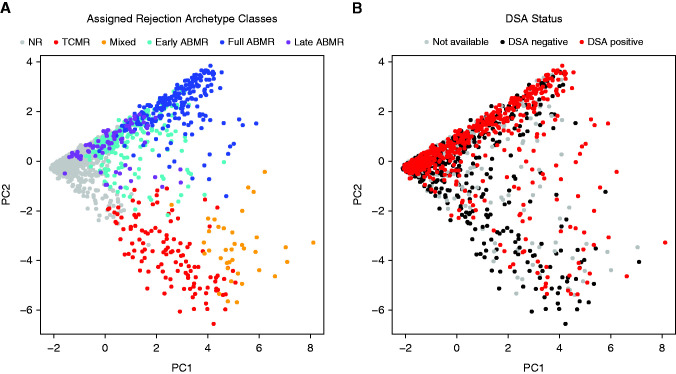
Figure 1.
Distribution of n=1679 biopsies using principal component analysis (PCA) and colored by archetype groups and DSA status. The main population of 1679 kidney transplant indication biopsy samples colored by (A) previously defined six-class rejection-based archetypal group assignment (NR, TCMR, mixed, early-stage ABMR, fully developed ABMR, and late-stage ABMR), and (B) the known DSA status of each biopsy sample (biopsy samples where the status is unknown are marked in gray). Biopsy specimens are distributed from NR to rejection across PC1 (x axis of [A]), and from ABMR to TCMR across PC2 (y axis of [A] and [B]). Therefore, biopsy samples with low probability of molecular rejection will be located to the left in PC1.

