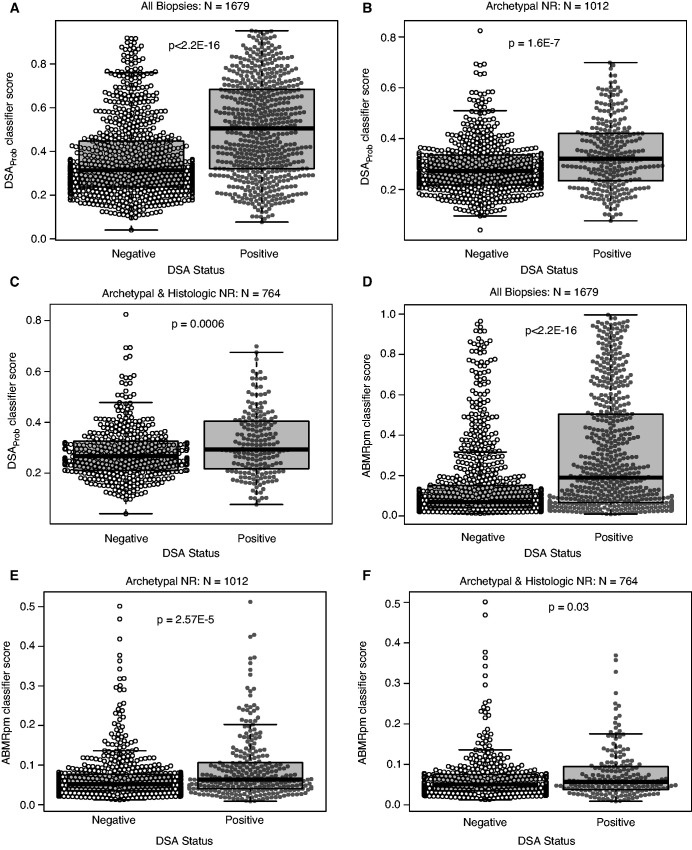
Figure 5.
Mean DSAProb and ABMRpm classifier scores differ between DSA positive and DSA negative biopsies. Beeswarms and boxplots showing the (A–C) DSAProb and (D–F) ABMRpm classifier scores divided by DSA status (DSA-positive versus DSA-negative). The center line of the box shows the median score in each group, whereas the box shows the data between the first and third quartiles of the scores (interquartile range or IQR). Whiskers mark 1.5×IQR. DSAProb classifier scores are shown divided into DSA-positive and DSA-negative groups in (A) all 1679 biopsy samples, (B) 1012 biopsy samples with no molecular rejection (NR), and (C) 764 biopsy samples with no molecular or histologic rejection. ABMRpm scores divided into DSA-positive and DSA-negative groups are shown in (D) all 1679 biopsy samples, (E) 1012 NR biopsy samples, and (F) 764 biopsy samples with no molecular or histologic rejection. All P values are calculated from Welch’s two-sample t tests comparing the DSA-positive and DSA-negative groups.

