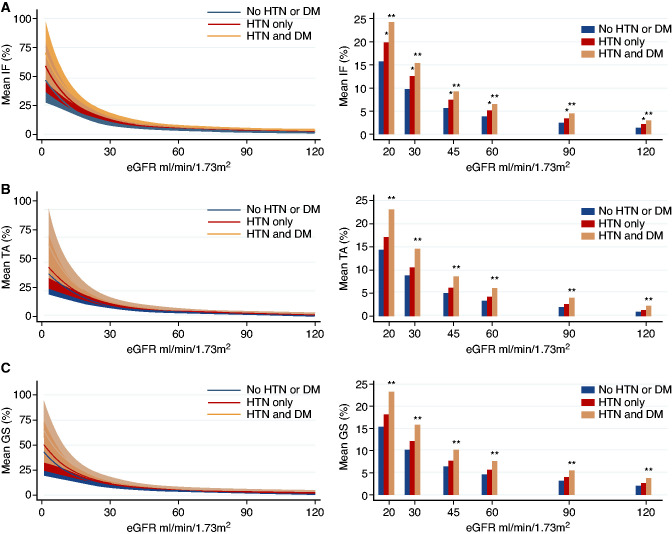
Figure 2.
The relationship of histologic alterations and kidney function stratified by HTN and diabetes. (A–C) Adjusted means for percent IF, TA, and GS stratified by absence of HTN and DM (n=193, navy lines±shaded 95% CI and navy bars), HTN alone (n=290, light blue lines±shaded 95% CI and light blue bars), and presence of HTN and DM (n=238, orange lines±shaded 95% CI shaded and orange bars). Percentages of IF, TA, and GS modeled using linear regression as a cubic function of eGFR3 adjusted for age, sex, race, HTN, diabetes, and BMI. Asterisk denotes P<0.05 compared with the “No HTN or DM” group, **P<0.01, * <0.05.

