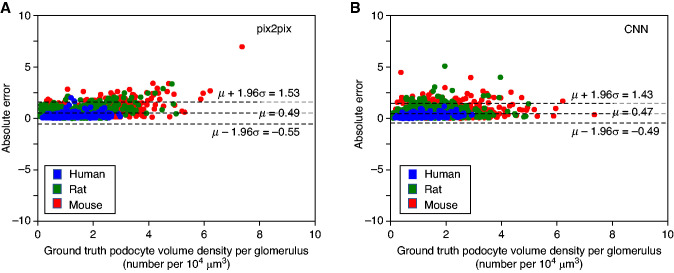
Figure 4.
Bland–Altman plots comparing GAN (pix2pix) and CNN-based results (with respect to manual ground-truth) for podocyte volume density estimation in mice, rats, and humans. The residual plots for GAN-based (A) and CNN-based (B) podocyte nuclear densities are shown here, when compared with the method reported by Venkatareddy et al.,11 (which is the ground-truth here). The results indicate that both networks generate similar podocyte volume densities to the ground-truth.

