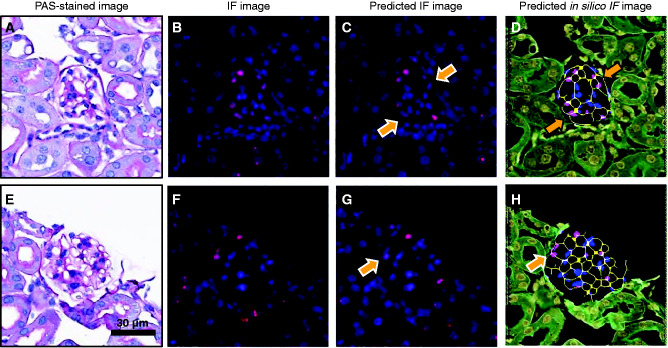
Figure 8.
GAN performance using different domain B images. PAS-stained glomeruli and corresponding ground-truth IF images are shown in (A) and (E) and (B) and (F), respectively. The network predictions for the two domain B images are shown in (C) and (G) (predicted IF images) and (D) and (H) (predicted in silico IF images). The arrows indicate nuclei that are faint in the predicted IF images, and hence are below the pipeline threshold for detection. The same nuclei are detected in the generated in silico images.

