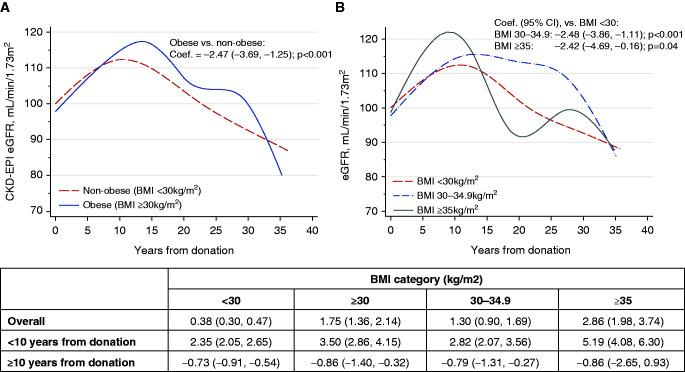
Figure 3.
Trajectory of eGFR (ml/min per 1.73m2) over time. (A) BMI <30 versus 30 kg/m2. (B) BMI <30, 30–34.9, >35 kg/m2. The trend of eGFR over time is depicted by the cubic spline plots. Difference in eGFR slope between obese and nonobese donors was compared using a generalized linear mixed model. The coefficient (slope) and 95% CI, which represents mean change over time, was reported for each group. The generalized linear mixed model used eGFR as the dependent variable and BMI category as the independent variable, and used a random intercept plus random slope model and unstructured covariance option. The cubic splines were also used to depict the distribution of adjusted hazard ratio of evaluated study outcomes across BMI range. Because the eGFR slope appeared to change direction after 10 years, a subanalysis using the piecewise generalized linear model for years 0–10 and years 10–30 were conducted.

