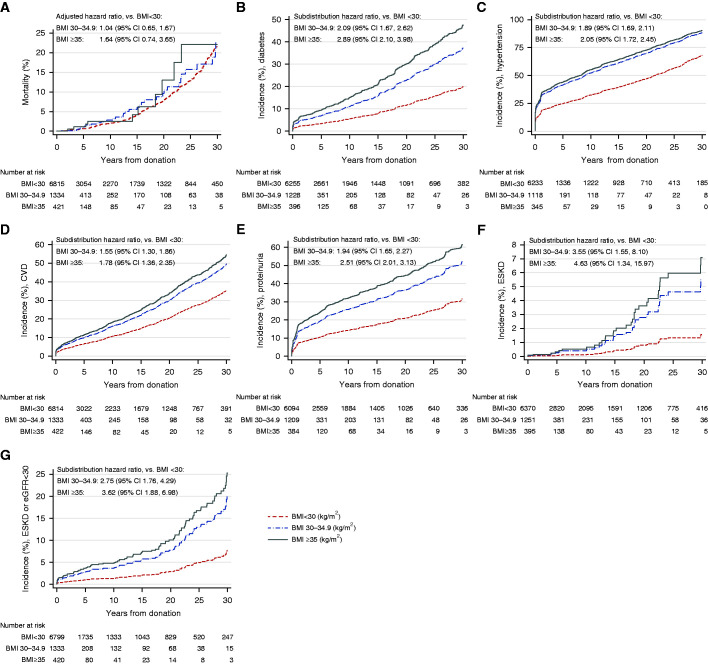
Figure 4.
Cumulative incidence of major outcomes. (A) Mortality. (B) Diabetes. (C) Hypertension. (D) CVD. (E) Proteinuria. (F) ESKD. (G) Composite of ESKD or eGFR<30 ml/min per 1.72m2. Kaplan–Meier curve was used for mortality; aHR for mortality obtained from the multivariable Cox proportional hazard model. Adjusted competing risk curves were used for outcomes other than mortality with the subdistribution hazard ratio obtained from the multivariable subdistribution hazard models (Fine and Gray method).

