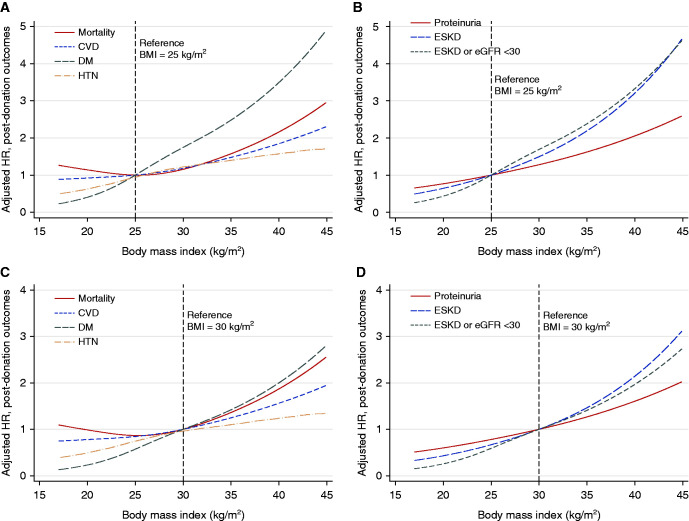
Figure 5.
Cubic spline plot for aHR, by BMI. (A) Nonrenal outcomes, BMI = 25 kg/m2 as the reference. (B) Renal outcomes, BMI = 25 kg/m2 as the reference. (C) Nonrenal outcomes, BMI = 30 kg/m2 as the reference. (D) Renal outcomes, BMI = 30 kg/m2 as the reference. aHRs were obtained from the multivariable Cox regression models for individual outcomes.

