Figure 1.
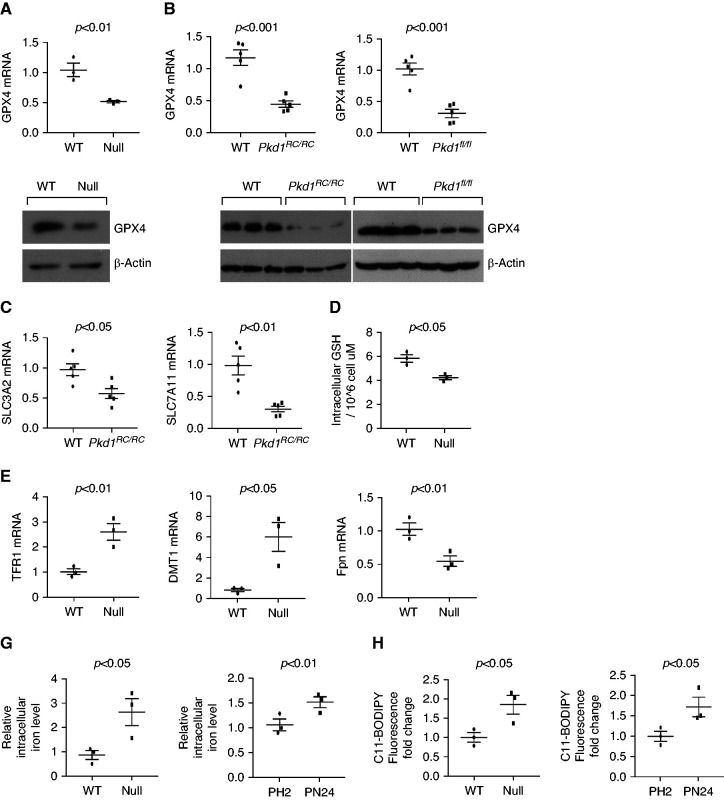
The expression of ferroptosis related genes was dysregulated in Pkd1 mutant renal epithelial cells and tissues. (A) qRT-PCR and Western blot analysis of GPX4 levels in Pkd1 wild-type (WT) and Pkd1−/− MEK cells. n=3 independent experiments. (B) qRT-PCR and Western blot analysis of GPX4 levels in kidneys collected from 3-month-old WT (n=5) and Pkd1RC/RC mice (n=5) and in kidneys collected from 21 days old WT (n=5) and Pkd1flox/flox:Pkhd1-Cre mice (n=5). (C) qRT-PCR analysis of SLC3A2 and SLC7A11 mRNA levels in kidneys collected from 3-month-old WT (n=5) and Pkd1RC/RC mice (n=5). (D) Intracellular GSH levels were measured in Pkd1 WT and Pkd1−/− MEK cells using a colorimetric assay kit (Methods). (E and F) qRT-PCR analysis of TFR1, DMT1, and Fpn mRNA levels in Pkd1 WT and null MEK cells (E) and kidneys collected from 3-month-old WT (n=5) and Pkd1RC/RC mice (n=5) (F). (G) Total intracellular iron levels were measured in Pkd1 WT and null MEK cells (left panel) and PH2 and PN24 cells (right panel) by an iron assay kit (Methods). n=3 independent experiments. (H) Lipid peroxidation was measured with 11C-BODIPY staining in Pkd1 WT and null MEK cells (left panel) and PH2 and PN24 cells (right panel) and was quantified with flow cytometry analysis. n=3 independent experiments. Statistical data are presented as the mean±SEM.

