Figure 3.
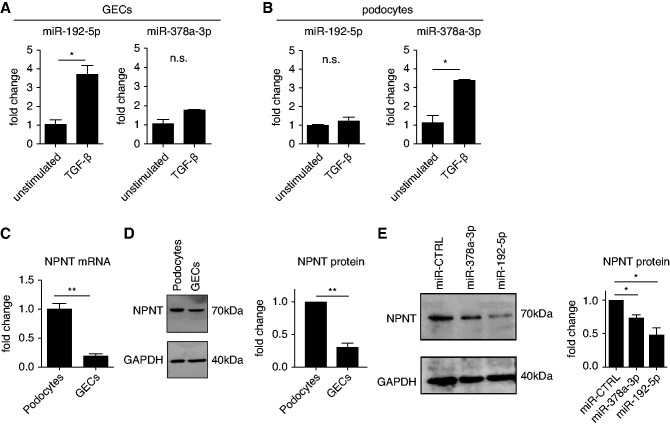
Glomerular endothelial cell miR-192-5p and podocyte miR-378a-3p regulate podocyte NPNT. (A) qPCR for miR-192-5p and miR-378a-3p expression normalized to U6 RNA in unstimulated and 48 hours TGF-β stimulated human GECs. Change in miR expression is given as fold change compared with the unstimulated condition. *P<0.05; n.s., nonsignificant. (B) qPCR for miR-192-5p and miR-378a-3p expression normalized to U6 RNA in unstimulated and 48-hour TGF-β–stimulated human podocytes. Change in miR expression is given as fold change compared with the unstimulated condition. *P<0.05. (C) qPCR for NPNT mRNA normalized by HPRT mRNA in cultured human podocytes and cultured human GECs. Difference in NPNT mRNA expression is given as fold change compared with podocytes. n=4; **P<0.01. (D) Left: Western blot analysis of NPNT in cultured human podocytes and cultured human GECs. Right: Difference in NPNT protein expression normalized by GAPDH is given as fold change compared with podocytes. n=3; **P<0.01. (E) Left: Western blot analysis of NPNT in cultured human podocytes after transfection with a miR-CTRL mimic, a miR-378a-3p mimic, and a miR-192-5p mimic. Right: Quantification of Western blot bands normalized by GAPDH. Results are given as fold change compared with unstimulated cells. n=4; * P<0.05.

