FIGURE 2.

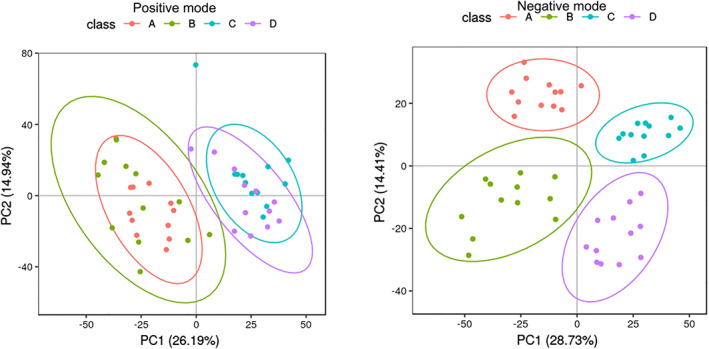
Metabolomic profiles of the zirconium oxide nanoparticles‐treated and control groups. The outline view of all samples shows the principal component analysis scores for both the positive and negative ion modes

Metabolomic profiles of the zirconium oxide nanoparticles‐treated and control groups. The outline view of all samples shows the principal component analysis scores for both the positive and negative ion modes