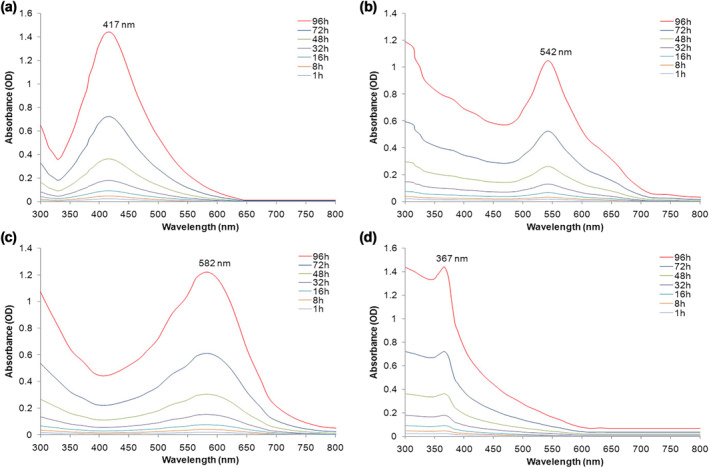
FIGURE 1.

UV–Vis spectra recorded as a function of time of reaction of 1 mM, (a) AgNO3, (b) HAuCl4, (c) CuSO4 and (d) ZnSO4 with cell‐free filtrate of Aspergillus kambarensis. The results displayed the range of AgNPs (417 nm), AuNPs (542 nm), CuNPs (582 nm) and ZnONPs (367 nm)
