FIGURE 7.

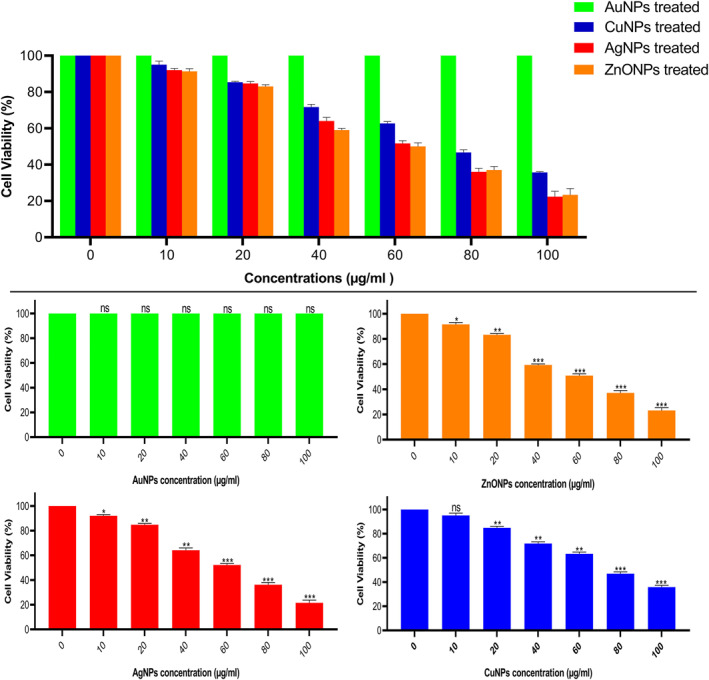
In vitro Cytotoxicity on HepG‐2 cells detection using MTT assay. Values are expressed as mean ± SD. All data were from three independent (N = 3) biological replicates in two separate experiments (*p ≤ 0.05, **p ≤ 0.01, ***p ≤ 0.001)

In vitro Cytotoxicity on HepG‐2 cells detection using MTT assay. Values are expressed as mean ± SD. All data were from three independent (N = 3) biological replicates in two separate experiments (*p ≤ 0.05, **p ≤ 0.01, ***p ≤ 0.001)