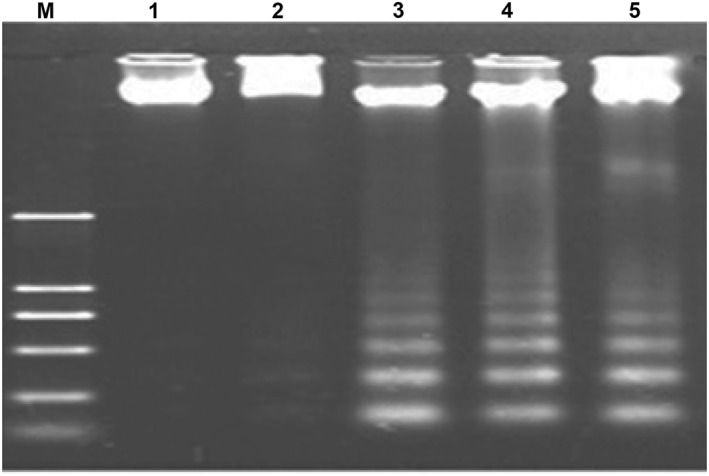
FIGURE 9.

DNA fragmentation analysis of HepG‐2 cell‐lines exposed to manufacture metallic nanoparticles (MNPs). Lanes: M: 100 bp DNA ladder. 1: DNA from untreated HepG‐2 cells shows normal uniform band, 2, 3, 4, and 5: DNA from MNP‐treated HepG‐2 cells for AuNPs, AgNPs, CuNPs and ZnONPs, respectively. No fragmentation is evident for AuNPs indicating its lack of effectiveness, while massive fragmentation is seen for AgNPs‐, CuNPs and ZnONPs‐treated cells
