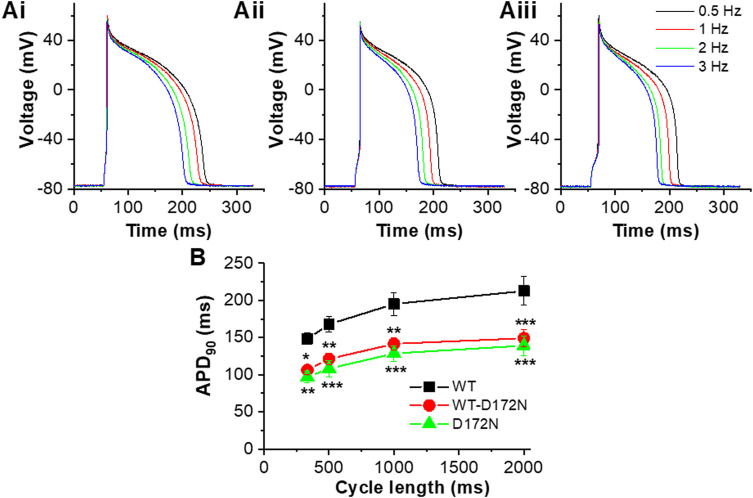
FIGURE 6.
AP rate-dependence for WT, WT-D172N and D172N IK1. (A). Example APs elicited in a single experiment at 4 stimulation frequencies (0.5, 1, 2, 3 Hz) with WT IK1 Ai, WT-D172N IK1 Aii and D172N IK1 Aiii. (B). Plot of APD90 against cycle length (1/frequency) for WT IK1 (black), WT-D172N IK1 (red) and D172N IK1 (green) (n = 5 cells from 4 hearts). “*” denotes statistical significance against WT of p < 0.05; “**” denotes statistical significance against WT of p < 0.01; “***” denotes statistical significance against WT of p < 0.001 (two-way ANOVA test, followed by Tukey’s multiple comparisons test; n = 5 cells from 4 hearts to which all IK1 formulations were applied).

