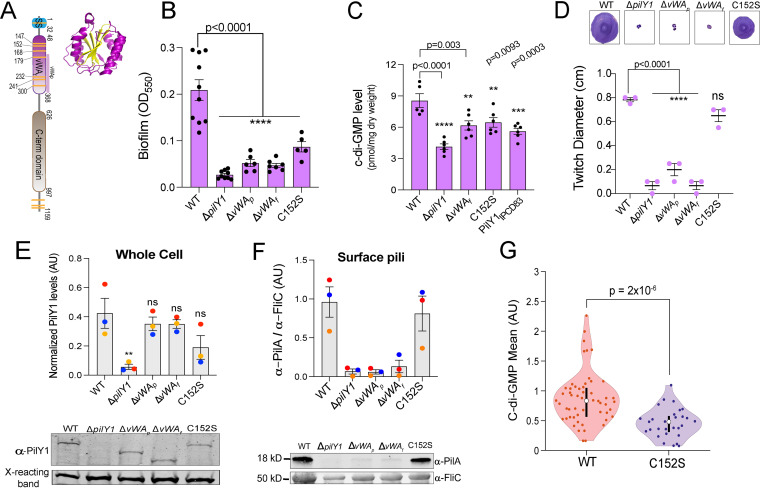
FIG 1.
The von Willebrand A (vWA) domain and Cys152 residue of PilY1 are important for regulating c-di-GMP levels and biofilm formation. (A) Schematic showing domain organization of the PilY1 protein. The signal sequence (SS; blue, amino acids 1 to 32), vWA domain (pink, amino acids 48 to 368), and C-terminal (C-term) domain (brown, amino acids 626 to 997) are highlighted. vWAp (amino acids S178 to S365) denotes a portion of the vWA domain that is deleted from a mutant analyzed in the subsequent panels. Yellow stripes represent the cysteines residues present in the protein. The vWA domain contains 7 of the 11 cysteine residues present in the full-length PilY1 protein, with the SS and the C-terminal region having 1 and 3 cysteine residues, respectively. (Inset) Ribbon diagram showing the vWF A2 domain (PDB accession no. 3GXB). The domain shows a classical Rossmann fold (8), comprised of central β-sheets (yellow) surrounded by α-helices (purple). (B) Biofilm formation measured at an OD550 for the WT, the ΔpilY1 deletion mutant, the vWA domain variants, and the Cys152S mutant in a static 96-well biofilm assay performed in M8 medium salts plus supplements (see Materials and Methods) and incubated at 37°C for 24 h. vWAp (amino acids 178 to 365 [see panel A]) and vWAf indicate a partial and a full (amino acids 48 to 368) deletion of the vWA domain, respectively. Data are from at least five biological replates, each with eight technical replicates. (C) Quantification of global c-di-GMP levels by mass spectrometry for the WT and the indicated mutants, shown in picomoles per milligram (dry weight). Cells were grown on 0.52% agar plates prepared with M8 medium salts plus supplements and then scraped from the plates after incubation for 37°C for 14 to 16 h. Data are from six biological replicates, each with two technical replicates. (D) Twitch diameter (in centimeters) for the WT and the indicated mutants measured after inoculating LB plates from overnight cultures and then incubating the plates for 24 h at 37°C plus for an additional day at room temperature. Representative images of twitch zones are shown above the graph. Data are from three biological replicates. (E) Quantification of normalized PilY1 protein levels in whole cells (in arbitrary units [AU]) for the WT and the indicated mutants. Cells were subcultured from an overnight culture and grown to mid-log phase in M8 medium salts plus supplements and normalized to the same OD600 value. Protein levels in whole-cell extracts are normalized to a cross-reacting band at ∼60 kDa, which is used as an additional loading control. The Cys152S mutant shows a modest but not significant reduction in PilY1 levels in whole-cell extracts. A representative Western blot image for PilY1 and the cross-reacting band is shown below the graph. (F) Quantification of normalized surface pilus levels. PilA (∼18 kDa) protein levels are used as a surrogate for surface pilus levels, which are normalized to levels of the flagellar protein, FliC (∼50 kDa). A representative Western blot is shown below the graph. All Western blot data are from three biological replicates in three independent experiments. Dots with the same color represent the same biological replicate; different colors indicate different biological replicates. *, P ≤ 0.05; ns, not significant. All error bars are standard errors of the means (SEM), and statistical significance was determined by one-way ANOVA and a Dunnett’s post hoc test. ****, P ≤ 0.0001; ***, P ≤ 0.001; **, P ≤ 0.01. (G) Violin plots showing the mean c-di-GMP of the WT strain and a strain expressing the vWA-Cys152S PilY1 variant during early biofilm formation. c-di-GMP level was quantified from GFP intensity, determined on a cell-by-cell basis in a microfluidic chamber for cells carrying the PcdrA-GFP construct, which is a reporter of c-di-GMP levels. Note that the WT data shown here were first reported in a previous publication (23); each strain analysis was done independently, in the same system and medium, with the same microscope at identical settings and processed as reported previously (23). Given that each analysis is independent but performed identically, we can compare data from previous studies. Each data point represents one tracked cell through an entire division cycle. Statistical significance was determined using the Kruskal-Wallis test (P = 2 × 10⁻⁶).

