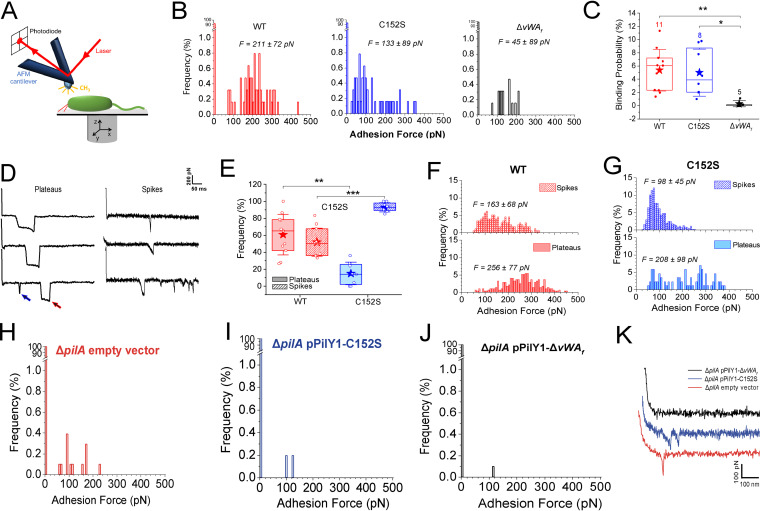
FIG 2.
Strains expressing the PilY1-Cys152S mutation display less adhesion force and altered mechanical behaviors than strains expressing WT PilY1. (A) For AFM measurements, it is required that probed cells are immobile. To immobilize the cells, we used a hydrophobic polystyrene surface that allowed for sufficient binding of the bacterium to the surface through its cell envelope to immobilize the cell. Force-distance curves were recorded in a square array at a bacterial pole (see Materials and Methods), because the pili are localized to the pole, which involved sequentially approaching the AFM tip toward the cell pole, making contact, and then retracting the tip. Adhesive interactions occurring between the pilus and the AFM tip upon contact allow catching and subsequently stretching the pilus as the AFM tip is retracted, which causes a deflection of the cantilever. This deflection is recorded by a laser beam and photodiode and is directly proportional to tensile force. The tensile force in the stretched pili can be determined from the generated force-distance curves. (B) Adhesion force histograms between the hydrophobic AFM tip and a representative WT strain or strains expressing the Cys152S or ΔvWAf variants of PilY1. For the WT, 211 ± 72 pN (n = 55 adhesive curves); for the vWA-Cys152S, 133 ± 89 pN (n = 47); and for the ΔvWAf, 45 ± 89 pN (n = 16). (C) Box plots comparing the binding probabilities of cells expressing WT PilY1 and of strains expressing the Cys152S or ΔvWAf variant of PilY1 are shown. The numbers of probed cells are indicated. Stars are the mean values, lines the medians, boxes the 25 to 75% quartiles, and whiskers the standard deviations (SD). *, P ≤ 0.05; **, P ≤ 0.01 (Student's t test). (D) Representative retraction force profiles exhibited by the WT or Cys152S mutant cells sorted based on their shape. Plateaus are defined as adhesive events with a “step” behavior, i.e., a constant sustained force over a defined length of time, while spikes are defined as sharp adhesive events with a single minimum. A single retraction profile can feature several plateaus (red arrow) and spikes (blue arrow), and both signatures can occur as marked by the arrows. (E) Box plots comparing the occurrences of plateau (shaded) and spike (striped) signatures for the WT and Cys152S mutant cells. The number of probed cells is as described for panel C. For the WT, plateaus were 60.8% ± 24.0% and spikes were 51.9% ± 16.6% (n = 11), and for Cys152S mutant, plateaus were 14.9% ± 13.3% and spikes were 93.1% ± 5.4% (n = 8). Stars are the mean values, lines the medians, boxes the 25 to 75% quartiles, and whiskers the SD. **, P ≤ 0.01; ***, P ≤ 0.001 (Student's t test). (F and G) Distribution of the adhesion forces exhibited by either the plateaus or the spikes for the WT (F) or the strain carrying the Cys152S mutant of PilY1 (G). The mean values are provided along with the histograms. All data were obtained by recording force-distance curves in medium containing M8 salts with an applied force of 250 pN and a pulling speed of 5 μm/s at room temperature. (H to K) The pilus fiber is required for adhesion to a surface. (H to J) Adhesion force histograms obtained by recording force-distance curves between the hydrophobic cantilever tip and representative ΔpilA/pPilY1 (H), ΔpilA/pPilY1-Cys152S (I), and ΔpilA/pPilY1-ΔvWAf (J) strains. (K) Representative retraction force profiles shown for the same strains.

