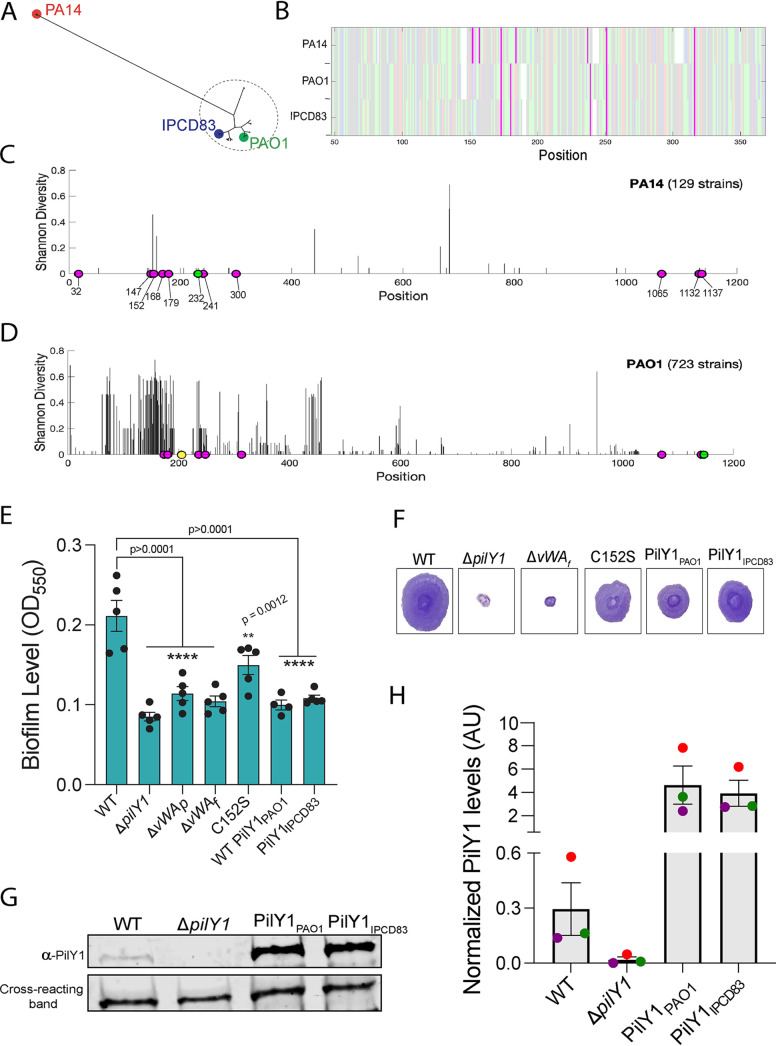
FIG 4.
Comparative genomic analyses reveal sequence and functional differences between PA14 and PAO1 alleles of PilY1. (A) Phylogenetic tree of PilY1 amino acid sequences obtained from the IPCD database of P. aeruginosa genomes (28) showing two distinct clades of PilY1 sequences corresponding to strains from the previously determined P. aeruginosa PA14 and PAO1 clades. The strain labeled IPCD83 is an isolate within the PAO1 clade. (B) Alignment of the vWA domain (amino acids 48 to 368) of PilY1 proteins found in the PA14, PAO1, and IPCD83 strains, with cysteines highlighted in magenta. Positive, negative, polar, and hydrophobic amino acids are depicted in light pink, blue, green, and gray, respectively. (C) Shannon diversity index along the PilY1 amino acid sequence for the 129 PilY1 proteins belonging to the PA14 clade. Fully conserved cysteines are highlighted in magenta. One strain is missing the cysteine depicted in green. (D) Shannon diversity index along the PilY1 amino acid sequence for the 723 versions of PilY1 proteins belonging to the PAO1 clade. Fully conserved cysteines are highlighted in magenta. One strain is missing the cysteine depicted in green, and one strain has an extra cysteine depicted in yellow. (E) Biofilm formation measured at an OD550 in a static 96-well assay for the indicated strains. Hybrid P. aeruginosa PA14 strains carry the PilY1 protein from PAO1 (PilY1PAO1) or the PilY1 protein from the IPCD83 strain (PilY1IPCD83), replacing the coding region for the P. aeruginosa PA14 PilY1 protein. In all cases, the mutant PilY1 variants are expressed from the native locus of P. aeruginosa PA14. Error bars are SEM, and statistical significance shown was determined by one-way ANOVA and Dunnett’s post hoc test. ****, P ≤ 0.0001; ***, P ≤ 0.001; **, P ≤ 0.01; ns, not significant. (F) Representative images of twitch zones shown for the indicated strains. (G) Representative Western blot image for steady-state PilY1 protein levels in whole cells expressing WT PilY1, the ΔpilY1 mutant, PilY1PAO1, and PilY1IPCD83. (H) Quantification of normalized PilY1 protein levels from whole cells for strains shown in panel G. Protein level is normalized to a cross-reacting band at ∼60 kDa. Data are from three biological replicates in three independent experiments. Dots with the same color represent the same biological replicate; different colors indicate different biological replicates.

