Figure 3. Temporal gene expression patterns of the Pomc(low)/Otp cluster and Pomc(low)/Tac2 cluster.
(A and E) Violin plots showing the expression of signature genes at each developmental stage in Pomc(low)/Otp cluster and Pomc(low)/Tac2 cluster, respectively. (B) Fluorescence in situ hybridization showing the co-localization of Pomc (green) and Npy (red) at E15.5. (C and G) Heatmaps showing the gene ontology analysis based on the top marker genes in the order of pseudotime in Pomc(low)/Otp cluster and Pomc(low)/Tac2 cluster, respectively. (D) Uniform Manifold Approximation and Projection (UMAP) plots showing cells in the Pomc(low)/Otp cluster expressing Sst, Agrp, Npy, Sst/Agrp, Sst/ Npy, or Agrp/Npy. Cells expressing Sst and cells expressing both Agrp/Npy are from two distinct cell populations. (F) Fluorescence in situ hybridization showing the co-localization of Pomc (green) and Tac2 (red), the co-localization of Pomc (green) and Tacr3 (red), and the co-localization of Pomc (green) and Sox14 (red) at the indicated developmental stages. Immunofluorescence showing the co-localization of TDTOMATO (red) and ESR1 (green) at the indicated developmental stages. Insets are magnified views of the indicated boxes. Arrows indicate co-expressing neurons in the merged panels. Scale bar: 50 µm. Image orientation: left, posterior; right, anterior; Pit: pituitary gland, RP: Rathke’s pouch.
Figure 3—figure supplement 1. Distribution of GABAergic and glutamatergic neurons in POMCDsRed cell clusters.
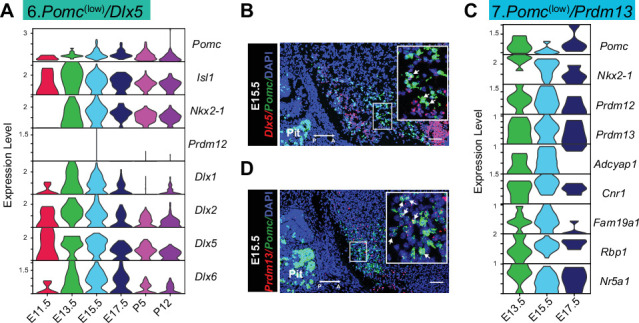
Figure 3—figure supplement 2. Temporal gene expression patterns of the Pomc(low)/Dlx5 and Pomc(low)/Prdm13 clusters.


