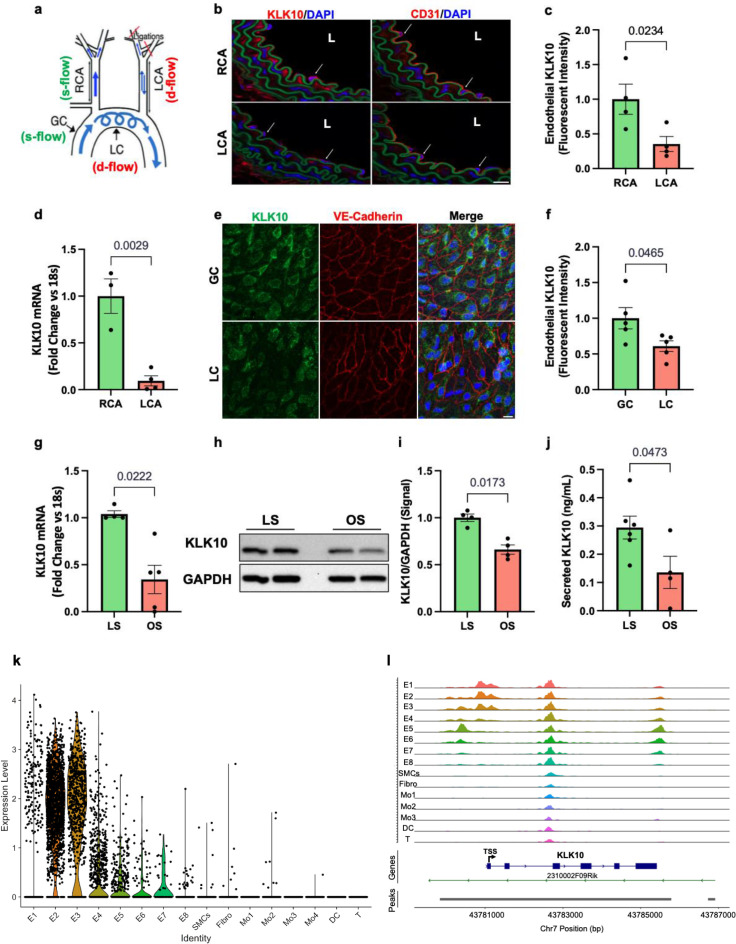
Figure 1. KLK10 expression is suppressed by disturbed flow (d-flow) and elevated by stable flow (s-flow) in endothelial cells (ECs) in vitro and in vivo.
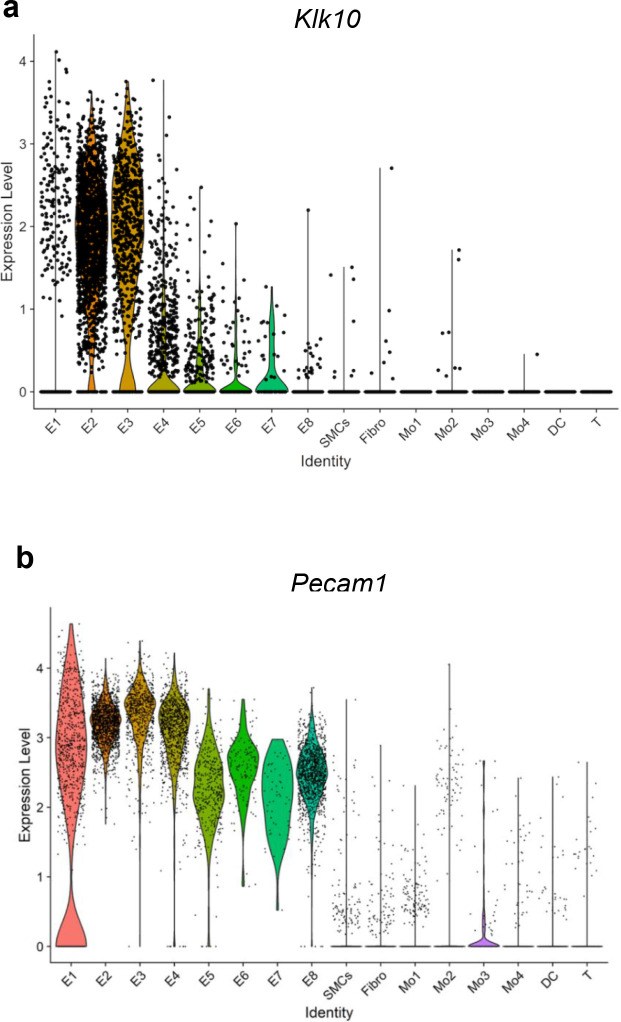
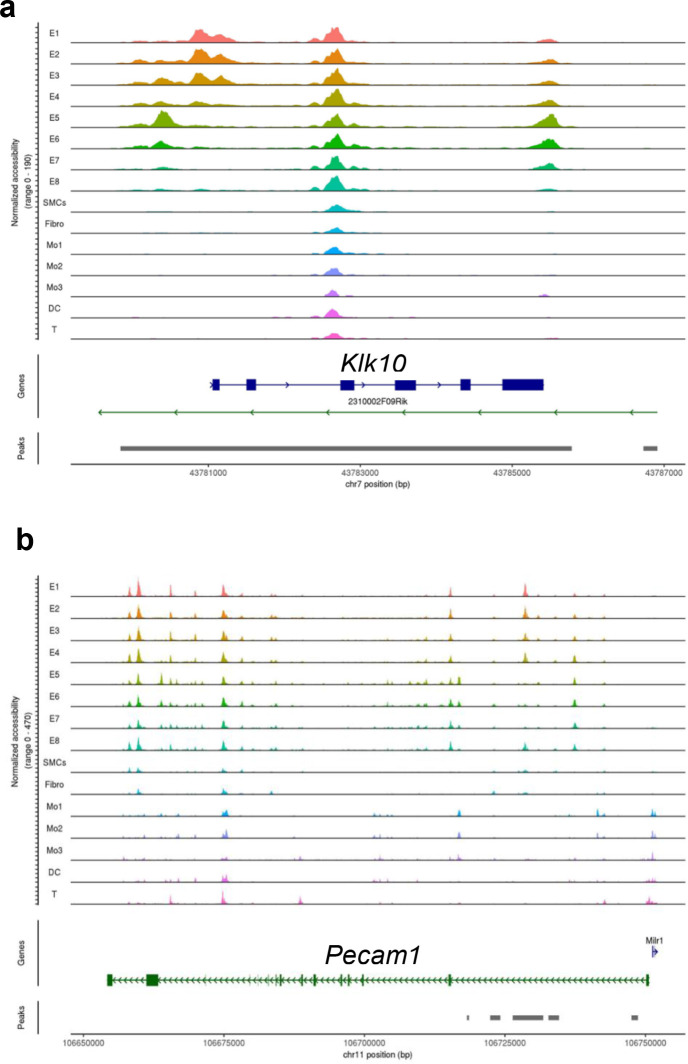
(a) Depiction of the partial carotid ligation (PCL) surgery and flow-sensitive regions in the aortic arch: right carotid artery (RCA; s-flow), left carotid artery (LCA; d-flow), greater curvature (GC: s-flow), and lesser curvature (LC; d-flow). Two days following the PCL of C57BL/6J mice, the RCA and LCA were collected for frozen section imaging (b, c) and (d) endothelial-enriched RNA preparation. (b) Confocal images of immunostaining with anti-KLK10 or anti-CD31 antibodies (red) and counterstained with 4',6-diamidino-2-phenylindole (DAPI, blue) are shown. Scale bar = 20 μm. Arrows indicate endothelial cells and L is the lumen. (c) Quantification of endothelial KLK10 fluorescence intensity expressed as fold-change normalized to the RCA. N = 4. (d) Klk10 mRNA was measured in endothelial-enriched RNA from the carotid arteries by quantitative real-time polymerase chain reaction (qPCR). Data are expressed as fold-change normalized to 18s internal control. N = 3–4. (e) Confocal images of en face coimmunostaining of the LC and GC with anti-KLK10 (green) and anti-VE-Cadherin (red) antibody are shown counterstained with DAPI (blue). Scale bar = 10 μm. (f) Quantification of endothelial KLK10 fluorescence intensity expressed as fold-change normalized to the GC. N = 5. (g–j) Human artery endothelial cells (HAECs) subjected to 24 hr of unidirectional laminar shear (LS; 15 dynes/cm2) or oscillatory shear (OS; ± 5 dynes/cm2) were used to measure expression of KLK10 mRNA by qPCR (g), KLK10 protein in cell lysates by western blot (h, i), and KLK10 protein secreted to the conditioned media by ELISA (j). N = 4–6. All data are represented as mean ± standard error of mean (SEM). Statistical analyses were performed using paired t-test (Figure 1—source data 1). (k) Single-cell RNAseq analysis of Klk10 gene transcripts and (l) single-cell ATACseq analysis of Klk10 chromatin accessibility in eight endothelial cell clusters (E1–E8), smooth muscle cells (SMCs), fibroblasts (Fibro), 4 monocytes/macrophages clusters (Mo1–4), dendritic cells (DCs), and T cells (T) in the mouse carotid arteries following 2 days or 2 weeks of the PCL surgery as we recently reported (Andueza et al., 2020). The published datasets (Andueza et al., 2020) were reanalyzed here for the Klk10 gene. E1–E4 clusters represent ECs exposed to s-flow conditions in the RCA. E5 and E7 clusters represent ECs exposed to acute (2 days) d-flow in the LCA. E6 and E8 clusters represent ECs exposed to chronic (2 weeks) d-flow in the LCA. TSS indicates transcription start site.


