. 2022 Jan 11;11:e72579. doi: 10.7554/eLife.72579

Figure 8. Flow-sensitive KLK10 inhibits endothelial inflammation and protects permeability barrier, ultimately reducing atherosclerosis.

KL10 is upregulated by s-flow and downregulated by d-flow at the genomic and protein levels. Under s-flow conditions when KLK10 is expression is high, KLK10 inhibits NFκB and expression of vascular cell adhesion molecule 1 (VCAM1) and intracellular adhesion molecule 1 (ICAM1), thereby preventing monocyte adhesion. Additionally, KLK10 produced by s-flow protects the endothelial permeability barrier. Together, the anti-inflammatory and barrier-protective effects of KLK10 lead to an overall protection against atherosclerosis.

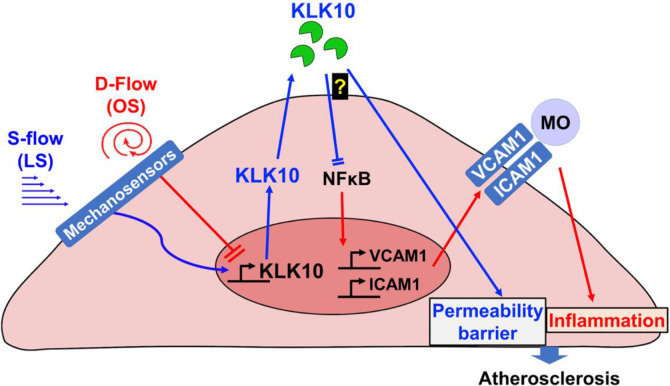
Figure 8.

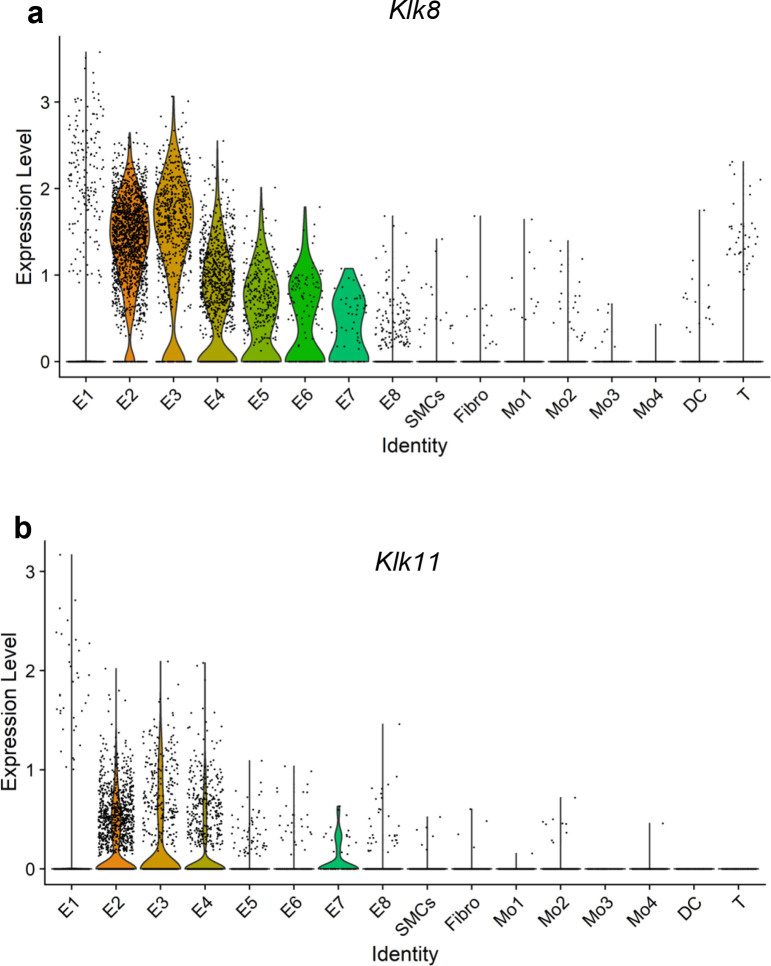
Figure 8—figure supplement 1. Single-cell RNA sequencing (scRNAseq) analysis of Klk8 and Klk11 from the partial carotid ligation (PCL) mouse model.

Figure 8—figure supplement 1.

Violin plots representing single-cell expression of (a) Klk8 and (b) Klk11 gene transcripts in eight endothelial cell clusters (E1–E8), smooth muscle cells (SMCs), fibroblasts (Fibro), 4 monocytes/macrophages clusters (Mo1–4), dendritic cells (DCs), and T cells (T) in the mouse carotid arteries following 2 days or 2 weeks of the PCL surgery as we recently reported (Andueza et al., 2020). The published scRNAseq data (Andueza et al., 2020) were reanalyzed here for Klk8 and Klk11 genes. E1–E4 clusters represent ECs exposed to s-flow conditions in the right carotid artery (RCA). E5 and E7 clusters represent ECs exposed to acute (2 days) d-flow in the left carotid artery (LCA). E6 and E8 clusters represent ECs exposed to chronic (2 weeks) d-flow in the LCA.

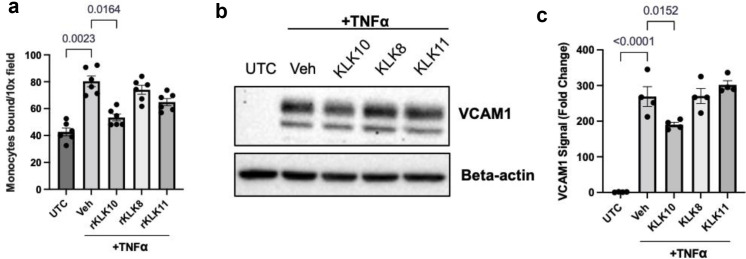
Figure 8—figure supplement 2. rKLK10, but not rKLK8 or rKLK11, inhibits monocyte adhesion and vascular cell adhesion molecule 1 (VCAM1) expression in human aortic endothelial cells (HAECs) exposed to TNFα.

Figure 8—figure supplement 2.

HAECs were treated with rKLK8, 10, or 11 (10 ng/ml each) or vehicle (UTC) for 16 hr, followed by TNFα (5 ng/ml) or vehicle for 4 hr. Then, (a) THP-1 monocyte adhesion assay and (b) western blot analysis for VCAM1 expression were performed (Figure 8—figure supplement 2—source data 1). (c) is the quantification of (b) using beta-actin as an internal control using the NIH ImageJ. One-way analysis of variance (ANOVA) was used for statistical analysis. Shown are mean ± standard error of the mean (SEM), n = 4–6.
Figure 8—figure supplement 2—source data 1. Western blots for VCAM1 and beta-actin.