
Author response image 4. Or7a has neutral valence A-C-E.
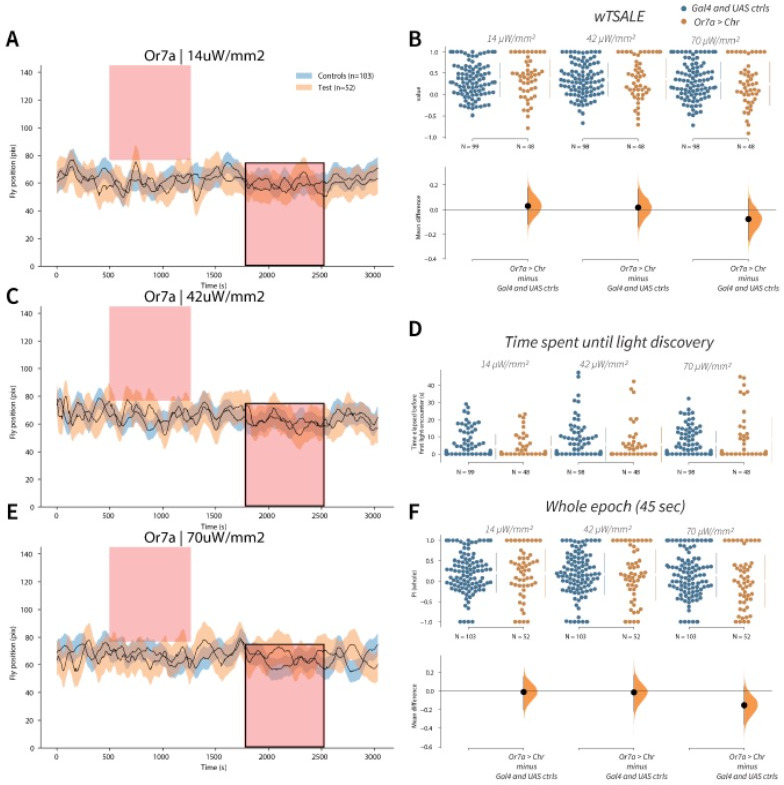
Trace plots representing the mean location of controls (w1118; Or7a-Gal4 and w1118; UAS-CsChrimson), and test flies (Or7a-Gal4 > UAS-CsChrimson) throughout an experiment at 14, 42, and 70 μW/mm2 light intensities. The blue and orange ribbons indicate 95% CIs for the control and test flies, respectively. Second epochs were used to calculate the preference scores (shown in black rectangle). B. An estimation plot presents the individual preference (upper axes) and valence (lower) of flies with activatable Or7a+ neurons in the WALISAR assay. In the upper panel, each dot indicates a preference score (wTSALE) for an individual fly: w1118; Or7a-Gal4 and w1118; UAS-CsChrimson flies are colored blue; and Or7a-Gal4 > UAS-CsChrimson flies are in orange. The mean and 95% CIs associated with each group are shown by the adjacent broken line. In the bottom panel, the black dots indicate the mean difference (ΔwTSALE) between the relevant two groups: the valence effect size. The black whiskers span the 95% CIs, and the orange curve represents the distribution of the mean difference. D. A scatter plot shows how long it takes for each fly to encounter the optogenetic light once it is switched on. The median and 95% CIs associated with each group are shown by the adjacent broken line. F. An estimation plot presents the preference index (PI) for each fly calculated by using the locomotion data from the whole epoch (45 seconds). The color-code, layout, and statistics are the same as Panel B.