(
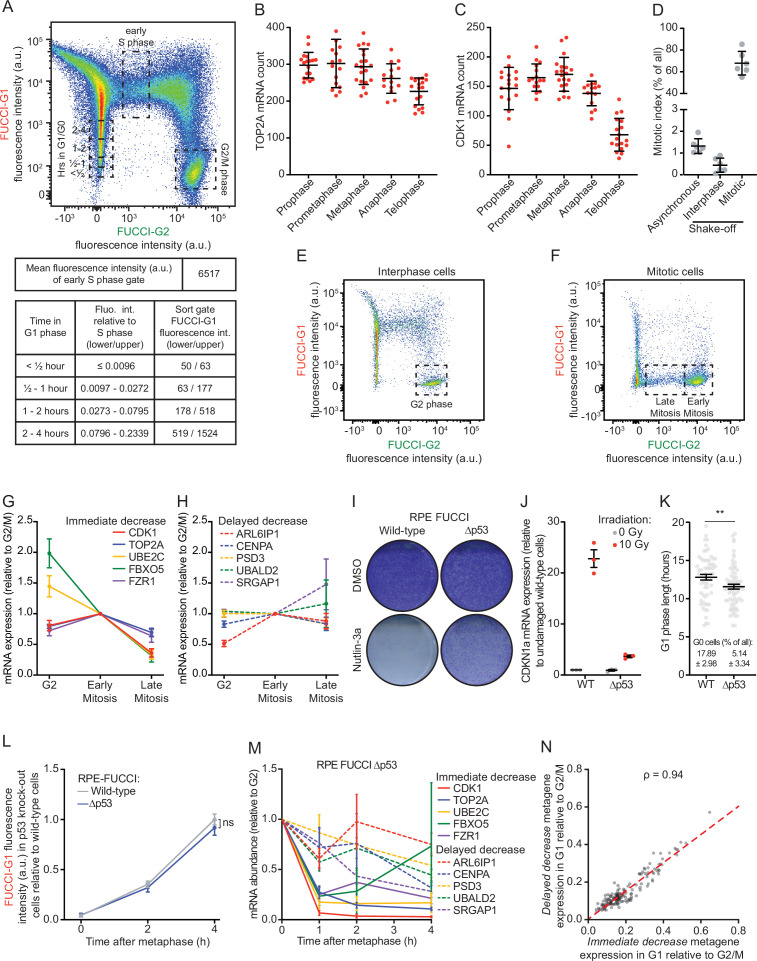
A) Gating strategy for the identification of G1, early S, and G2 phase cells in fluorescence activated cell sorting (FACS) analysis of asynchronously growing REP-fluorescent, ubiquitination-based cell cycle indicator (FUCCI) cells (top). The tables below the FACS plot display the FUCCI-G1 fluorescence intensity associated with cells at various times in G1 or S phase. The top table shows the mean FUCCI-G1 fluorescence intensity during early S phase obtained. In the lower table, the left column states the time a cell has spent in G1 phase. The middle column indicates the FUCCI-G1 fluorescence intensities relative to cells in early S phase (calculated using the polynomial equation). The right column shows the range in absolute FUCCI-G1 fluorescence intensities in each bin. These intensities were calculated by multiplying the mean FUCCI-G1 fluorescence intensity in early S phase (6517, see top table) by the fluorescence intensity relative to S phase (middle column, lower table). The resulting fluorescence intensity ranges were used to set the sorting gates for the isolation of cells at different times in G1 phase. These gates are indicated in the FACS plot above. (
B–C) Quantification of the number of TOP2A (
B) and CDK1 (
C) transcripts in different phases of mitosis. Each dot represents the number of transcripts in a single cell and lines with error bars represent average ± SD (at least 15 cells per experiment per condition analyzed, see
Supplementary file 2 for the exact number of cells included). One representative of three experiments is shown. (
D) Fraction of mitotic cells in different isolated cell populations. Cells were either left untreated (asynchronous) or mitotic shake-off was performed to split the cells into two populations: Mitotic cells (collected cells from shake-off that are highly enriched for mitotic cells) and interphase cells (adherent cells remaining after shake-off that are depleted of mitotic cells). After isolation of different populations of cells, cells were fixed and stained with DAPI for DNA content measurements and for the mitosis-specific marker phosphorylated histone 3 ser 10, and the fraction of mitotic cells was determined by FACS for each cell population (see Materials and methods). Lines with error bars represent average ± SD of six experiments. (
E–F) FACS strategies to enrich for G2 phase cells (
E), early mitotic cells, or late mitotic cells (
F). RPE-FUCCI cell populations depleted of mitotic cells (
E) or enriched for mitotic cells (
F) were isolated as in (
D). The population of cells enriched for interphase cells (‘interphase’ in D) was used to isolate G2 phase cells. The population of cells enriched for mitotic cells (‘mitotic’ in D) was used to isolate early and late phase mitotic cells (prometaphase/metaphase and anaphase/telophase, respectively). Early and late mitotic cells were distinguished using FUCCI-G2 fluorescence levels: cells that express high levels of the FUCCI-G2 marker are early mitotic cells and cells that express low levels of the FUCCI-G1 marker are late mitotic cells. (
G–H) Relative mRNA levels of indicated genes in G2, early and late mitosis, as measured by RT-qPCR. RPE-FUCCI cells in G2 phase, early and late mitosis were isolated by FACS (see
E-F). mRNA expression levels of five genes from the
immediate decrease group (
G) and five genes from the
delayed decrease group (
H) were analyzed. Dots and error bars represent average ± SEM of three to five experiments. (
I) Crystal violet staining of wild-type and p53 knock-out RPE-FUCCI cells that were treated with Nutlin-3a for 1 week. A representative experiment of two experiments is shown. (
J) Validation of p55 knock-out cells. Wild-type and p53 knock-out RPE-FUCCI cells were irradiated using 10 Gy of ɣ-irradiation, or left unirradiated. Five hours later, cells were lysed and CDKN1a expression was analyzed by RT-qPCR. Lines with error bars represent average ± SEM of three experiments. (
K) Analysis of G1 phase duration and the fraction of G0 (quiescent) cells in p53 knock-out cells. RPE-FUCCI wild-type or p53 knock-out cells were imaged for at least 21 hr. The duration of G1 phase in cells entering G1 during the first hour of imaging was analyzed. G0 (quiescent) cells are defined as cells that maintain FUCCI-G1 fluorescence for >20 hr. Pooled data of two experiments is shown. Per cell line 20 cells were included per experiment. (
L) Accumulation of the FUCCI-G1 fluorescence in wild-type and p53 knock-out RPE-FUCCI cells. Wild-type and p53 knock-out RPE-FUCCI cells were imaged by time-lapse microscopy. FUCCI-G1 fluorescence was determined for cells at metaphase and 2 or 4 hr thereafter. Fluorescence intensities were normalized against the average fluorescence intensity of wild-type cells at 4 hr post-metaphase. Bots and error bars indicate average ± SEM of three experiments. At least 10 cells per condition per experiment were quantified (see
Supplementary file 2). (
M) Validation of the two waves of mRNA decline. RPE-FUCCI p53 knock-out cells at indicated stages of the cell cycle were isolated by FACS (see A for sorting strategy). mRNA expression levels of indicated genes were measured by RT-qPCR. Five genes from the
immediate decrease group and five genes from the
delayed decrease group were selected. Dots and error bars represent average ± SEM of three to five experiments. (
N) Correlation plot comparing the relative expression of
immediate decrease genes to the relative expression of
delayed decrease genes in single cells. Cells were selected that have spent at least 4 hr in G1 phase (158 cells in total). For individual cells, we averaged the expression of all genes belonging to either the
immediate or
delayed decrease groups, thus creating two metagenes. We then normalized the expression of both metagenes to the average expression of either metagene in G2 phase cells. Red dashed line represents the linear model fit to the data. For all panels, p-values are based on an unpaired one-tailed Student’s t-test. p-Values are indicated as * (p < 0.05), ** (p < 0.01), *** (p < 0.001), ns = not significant. See
Supplementary file 2 for the exact number of included cells in each condition.


