. 2022 Feb 1;11:e71356. doi: 10.7554/eLife.71356

Figure 3. mRNA decay occurs during a brief window of time as cells exit mitosis and enter G1 phase.

(A) Violin plot showing the ratio of transcription in G1 phase versus G2 phase for the 220 genes that we identified as downregulated in G1 phase. Data were retrieved from Battich et al., 2020. Battich et al. labeled new transcripts for 30 min using EU, and old and new transcripts were quantified using deep sequencing. We defined the relative rate of transcription as the number of labeled transcripts in G1 versus G2 phase. Dashed line indicates a ratio of 1, indicative of a similar transcription rate in G2 and G1 phase (a ratio <1 is indicative of reduced transcription in G1 phase). (B) Schematic of the mathematical model that was used to fit the decrease in mRNA levels as cells progress from mitosis into G1 phase. (C) Boxplot of mRNA half-lives for the genes that were identified as downregulated in G1 phase in our study. Half-lives at the mitosis-to-G1 (M-G1) transition are shown (this study), as well as the half-lives of the same genes determined in asynchronous cell populations in HeLa cells (Tani et al.), mouse embryonic stem cells (Herzog et al.) and mouse fibroblasts (Schwanhausser et al.). (D) Relative mRNA levels in mitosis after different times of transcription inhibition, as measured by RT-qPCR. RPE-1 cells were synchronized in G2 using the CDK1-inhibitor RO-3306. Subsequently, cells were released from RO-3306 into medium containing Taxol, to arrest cells in mitosis. Mitotic cells were collected by mitotic shake-off, and cultured for an additional 2 hr in the presence or absence of the transcription inhibitor Actinomycin D (blue and red lines, respectively). For comparison, mRNA levels during the M-G1 phase transition are shown (gray line). Note that mRNA of indicated genes is stable in mitosis, indicating that mRNA is degraded specifically during the M-G1 phase transition. Lines with error bars indicate average ± SEM of three experiments. (E) Relative mRNA levels in G2 and late G1 phase after different times of transcription inhibition, as measured by RT-qPCR. Asynchronously growing RPE-fluorescent, ubiquitination-based cell cycle indicator (FUCCI) cells were treated with Actinomycin D for indicated times. Cells were then fluorescence activated cell sorting (FACS)-sorted and G2 phase cells and late G1 phase cells (>4 hr into G1 phase) were isolated based on FUCCI reporter fluorescence. The mRNA levels of indicated genes were then measured by RT-qPCR. mRNA levels during the M-G1 phase transition are shown for comparison (gray lines). Note that mRNA levels are substantially less stable in cells during the M-G1 phase transition compared to G2 or late G1 phase cells. Lines with error bars indicate average ± SEM of three experiments. p-Values are based on a one-tailed unpaired Student’s t-test (C-E), and are indicated as * (p < 0.05), ** (p < 0.01), *** (p < 0.001), ns = not significant.

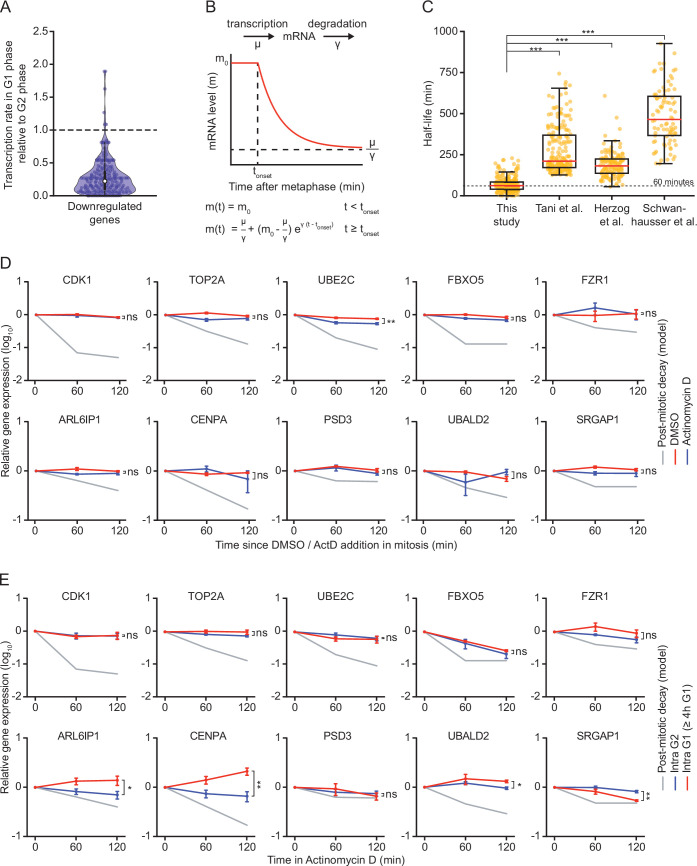
Figure 3.

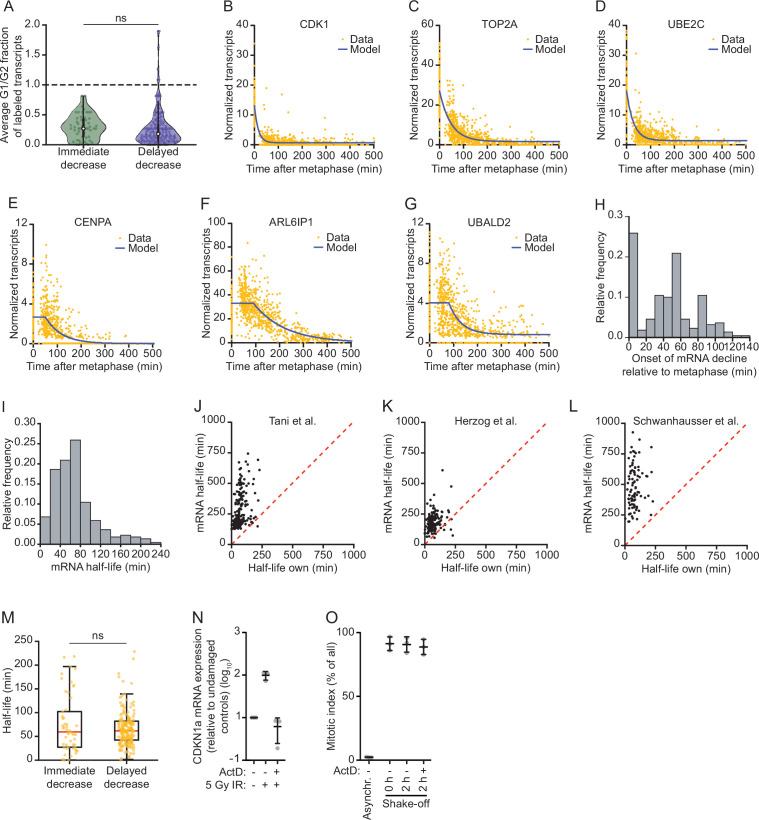
Figure 3—figure supplement 1. mRNA decay occurs during a brief window of time as cells exit mitosis and enter G1 phase.

Figure 3—figure supplement 1.

(A) Violin plot showing the ratio of transcription in G1 phase versus G2 phase for the genes belonging to the immediate decrease or delayed decrease groups (Figure 2A and Supplementary file 1). Data were retrieved from Battich et al., 2020. New transcripts were labeled for 30 min using EU, and old and new transcripts were quantified using deep sequencing. The relative rate of transcription was defined as the number of labeled transcripts in G1 versus G2 phase. Dashed line indicates supplemnetary filea ratio of 1, indicative of a similar transcription rate in G2 and G1 phase (ratios < 1 are indicative of reduced transcription in G1 phase). (B–G) mRNA abundance over time for genes that undergo mRNA decay at the mitosis-to-G1 (M-G1) transition. Blue lines indicate the best fit obtained using the mathematical model described in Figure 3C. Representative genes of the immediate decrease group (CDK1, TOP2A, and UBE2C) and the delayed decrease group (CENPA, ALR6IP1, and UBALD2) are shown. (H) Histogram of the time (relative to metaphase) when mRNA levels start to decline is shown for genes that are downregulated during the M-G1 phase transition. mRNA levels over time were fit as in B–G and the onset time of mRNA decline was determined for each of the 220 downregulated genes. (I) Histogram of mRNA half-lives for the 220 genes that are downregulated during the M-G1 phase transition. To obtain mRNA half-lives, mRNA levels over time were fit as in B–G and the mRNA half-lives were calculated using the mathematical model described in Figure 3 (see Materials and methods). (J–L) Comparison of mRNA half-lives during the M-G1 phase transition with mRNA half-lives in asynchronous cells determined in previous studies (Herzog et al., 2017; Schwanhäusser et al., 2011; Tani and Akimitsu, 2012). Dashed lines indicate identical half-lives. Note that the half-lives of most genes are shorter during the M-G1 phase transition than in asynchronous growing cells. (M) Boxplot of mRNA half-lives of immediate and delayed decrease genes. For each gene, the half-live was determined from the moment mRNA levels start to decrease (see Supplementary file 1). (N) Analysis of transcription inhibition by Actinomycin D. Expression levels of the DNA damage-induced gene CDKN1a were measured by RT-qPCR in cells that were DNA damaged (exposed to 5 Gy ionizing radiation), in the presence or absence of Actinomycin D, relative to non-irradiated cells. Lines with error bars indicate average ± SEM of three experiments. (O) Mitotic index of RPE-1 cells treated with the transcription inhibitor Actinomycin D. RPE-1 cells were arrested in G2 phase using a CDK1 inhibitor (RO-3306). After 16 hr, the CDK1 inhibitor was removed and replaced by Taxol, thereby releasing cells from the G2 phase arrest and blocking cells in mitosis. Forty-five minutes later, mitotic cells were collected through mitotic shake-off, after which Actinomycin D was added for up to 2 hr. Cells were fixed and the fraction of mitotic cells was determined by fluorescence activated cell sorting (FACS) (by staining cells for DNA content and the mitosis-specific marker phosphorylated histone 3 at ser 10). Lines with error bars indicate average ± SEM of three experiments. p-Values are based on a one-tailed Student’s t-test, and indicated as * (p < 0.05), ** (p < 0.01), *** (p < 0.001), ns = not significant.