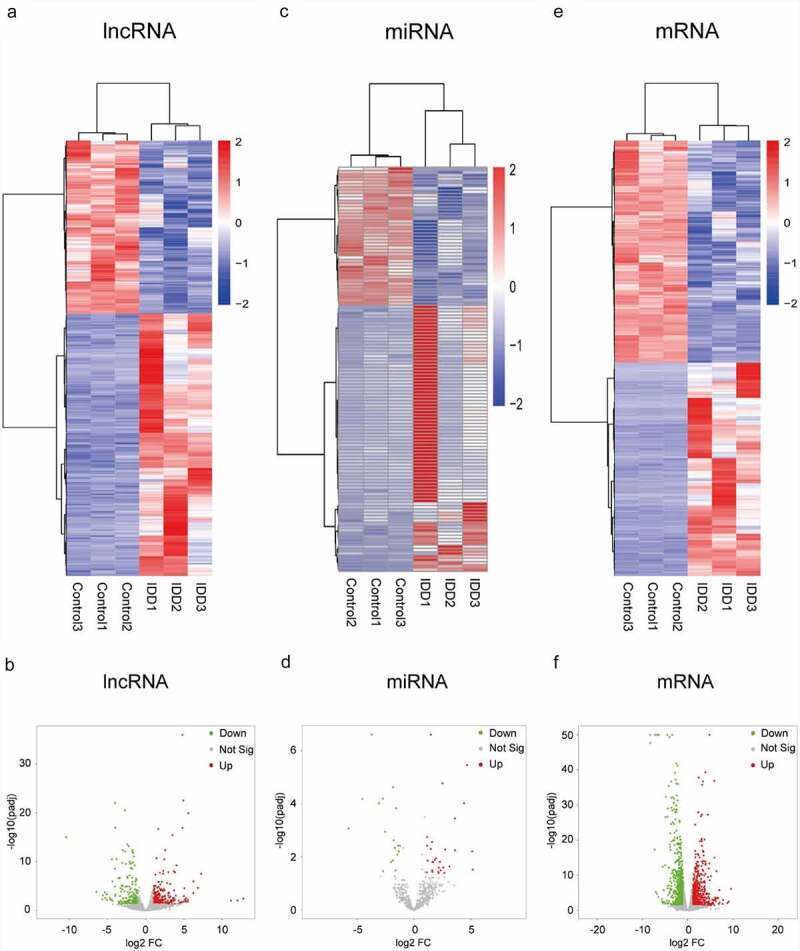
Figure 1.

Expression profiles of lncRNAs, miRNAs and mRNAs. (a) Heat map of DELs in the IDD group compared with the control group. (b) Volcano plot of the DELs. (c) Heat map of DEMis. (d) Volcano plot of DEMis. (e) Heat map of DEMs. (f) Volcano plot of DEMs. IDD, intervertebral disc degeneration; lncRNA, long noncoding RNA; miRNA, microRNA; DELs, differentially-expressed lncRNAs; DEMis, differentially-expressed microRNAs; DEMs, differentially-expressed mRNAs
