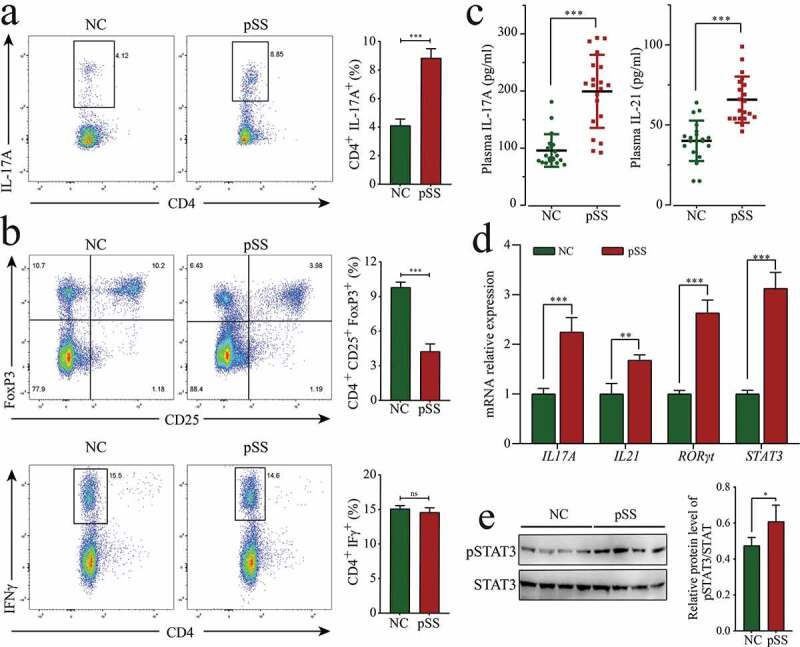
Figure 2.

The increase in the percentage of Th17 cells in pSS patients. (a) Changes in the percentage of Th17 (CD4+ IL-17A+) in the PBMCs of pSS patients and NCs. (b) Changes in the proportions of Treg (CD4+ CD25+ FoxP3+) and Th1 (CD4+ IFN-γ+) in the PBMCs of pSS patients and NCs. (c) Levels of IL-21 and IL-17A in the plasma of subjects by ELISA. (d) MRNA expression of the cytokines IL-21 and IL-17A and transcription factors RORγt and STAT3 in the PBMCs of subjects by RT-qPCR. (e) pSTAT3 (Y705) protein expression in the PBMCs of subjects by WB. ns: not significant, ** p ≤ 0.01, *** p ≤ 0.001 by Student’s t-tests
