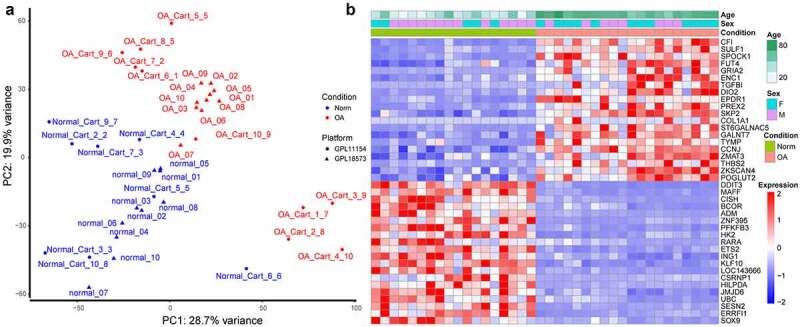
Figure 1.

Sample clustering and differentially expressed genes (DEGs) between osteoarthritic (OA) and normal samples. (a) principal component analysis (PCA) plot of samples after removing batch effect. PC1: the first principal component; PC2: the second principal component. (b) heat map for DEGs. The top 20 upregulated or downregulated DEGs ranked by adjusted p values are displayed
