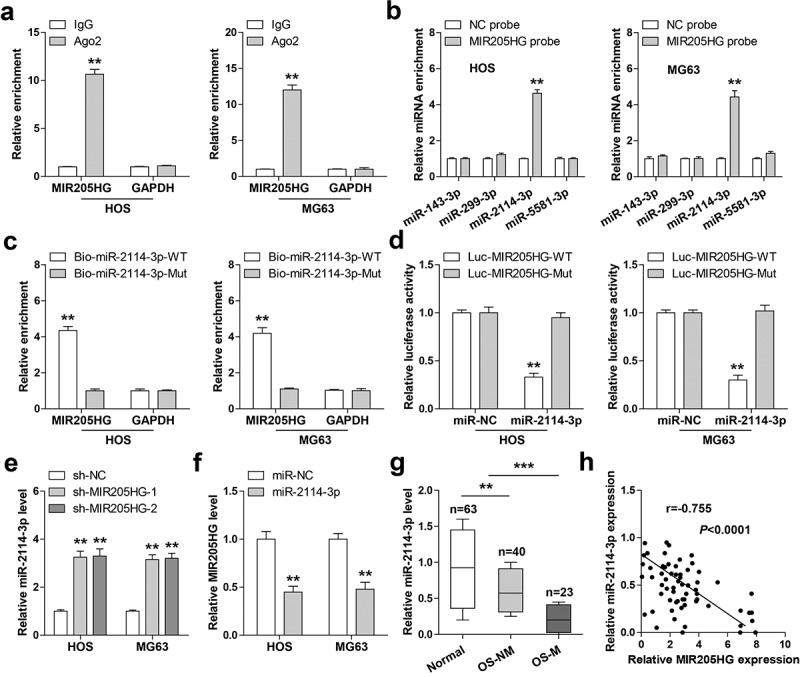
Figure 3.

MIR205HG sponges miR-2114-3p. (a). RIP assay in OS cells with anti-Ago2 antibody, followed by qRT-PCR analysis of MIR205HG and GAPDH enrichment. (b,c). RNA pull-down assay using biotin-labeled MIR205HG/miR-2114-3p probe, followed by qRT-PCR analysis of relative enrichment. (d). Luciferase reporter assay detecting the binding of miR-2114-3p on MIR205HG. (e, f). qRT-PCR analysis of miR-2114-3p/MIR205HG levels in MIR205HG-silenced/miR-2114-3p-overexpressed OS cells. (g). qRT-PCR analysis of miR-2114-3p in normal and OS tissues. H. The correlation between MIR205HG and miR-2114-3p in OS tissues. **P< 0.01, ***P< 0.001
